
Instruction Manual

4-15
IM 04L47B01-01EN
1
2
3
4
5
IndexIndex
Data Display Methods
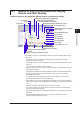
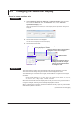
A grid of 1 hour/div or more shows the plotted time and time axis scale of contraction
scale.
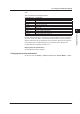
Time axis contraction scale and grid position
Contraction scale Grid position
1hour/div 00:00:00, 1:00, 2:00. ..., 23:00
2hour/div 0:00, 2:00, 4:00, 6:00, 8:00, 10:00, 12:00, 14:00, 16:00, 18:00, 20:00, 22:00
3hour/div 0:00, 3:00, 6:00, 9:00, 12:00, 15:00, 18:00, 21:00
4hour/div 0:00, 4:00, 8:00, 12:00, 16:00, 20:00
6hour/div 0:00, 6:00, 12:00, 18:00
8hour/div 0:00, 8:00, 16:00
12hour/div 0:00, 12:00
1day/div 1st 00:00:00, 2nd, 3rd, ..., 31st
7day/div Monday of each week 00:00:00
1month/div Jan 1st 00:00:00, Feb 1st, ..., Dec 1st
3month/div Jan 1st, April 1st, July 1st, Oct 1st
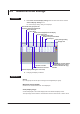
However, there are restrictions. The maximum number of data that can be compressed
per pixel is 10,000. (For data of 1-second intervals, the maximum contraction scale is 7
days/div.) Data cannot be compressed beyond this restriction. Note that if the restriction
is exceeded through an additional display, the compression ratio is adjusted, and
message M10021 is displayed (see section 5.1).
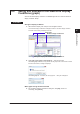
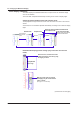
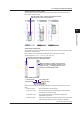
Display with time specification
The specified time range is displayed.
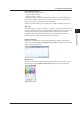
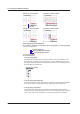
Changing the waveform thickness
On the menu bar, click Display > Thickness of wavy line > Normal, Middle, or Thick.
4.5 Changing the Waveform Display