
Instruction Manual

4-14
IM 04L47B01-01EN
4.5 Changing the Waveform Display
Zoom in / zoom out time axis
Procedure
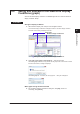
1.
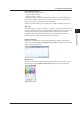
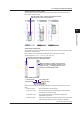
Select Time Axis > Zoom in, Zoom out, or Time axis Form to from the menu
bar or click the “Zoom
in” icon, the “Zoom out” icon, or the “Time axis
specification display” icon.
When time specification is selected, the “Trend display section specification” dialog box is
displayed.
2.
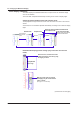
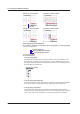
Set the date and time to be displayed.
The set section is displayed as waveform display.
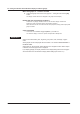
3.
Set the time and the date.
Clicking displays the calendar
Select the date
Clicking switches to the preceding or the following month
Click the numerical value to be changed to
highlight it. Then it can be changed
Highlight the numerical value by
clicking and enter the changed
value or use the Up/down button
to change the value
Up/down button
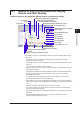
Explanation
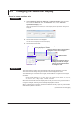
Time axis maximum setting: One grid interval of the time axis represents 3 months.
Time axis minimum setting: One grid of the time axis is displayed as 50 ms.
The initial setting is 10 seconds for one grid, and the width of one grid can be changed
as follows.
5
0 ms, 100 ms, 500 ms, 1 s, 5 s, 10 s, 30 s, 1 min, 5 min, 10 min, 30 min, 1 h, 2 h, 3 h,
4 h, 6 h, 8 h, 12 h, 1 day, 7 days, 1 month, 3 months
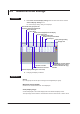
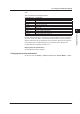
When DST is used with time axis display with one day or more for one grid, the width of
one grid is changed, and the grid line is always displayed at 0 hours.
When 1 grid interval is 3 months, grid lines are fixed for January, April, July, and October.
Grid lines are plotted on the hour.
(Continued on the next page)