
Instruction Manual

4-10
IM 04L47B01-01EN
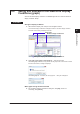
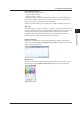
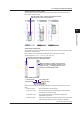
When Save graph as… has been selected
3.
Change the graph name in the “Save graph as…” dialog box and click the [OK]
button.
The display condition file name is displayed in the graph list as list display.
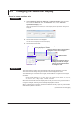
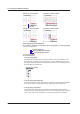
Redraw with the saved display conditions
Double-click any display conditions name from the waveform display conditions list.
Redraw the graph is performed with the saved display conditions.
When files which can be connected have been newly imported, always perform display after
graph connection.
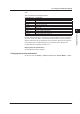
Copy to clipboard
On the menu bar, click Edit > Copy to clipboard, or press Ctrl + C.
The waveform display on screen is copied to the clipboard as bitmap data.
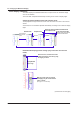
Explanation
Graphs can be searched by time, tag name, group name, mark, message, or graph
name.
Saved graphs cannot be displayed with the viewers of our software DAQSTANDARD or
DAQEXPLORER.
Graphs also can be saved with “Data” selected in the navigation window. When “Graph”
is selected, the saved graph name is displayed.
If you display [Graph], the display is based on the display settings at the time the graph
was saved rather than the waveform display default settings (see section 4.1).
4.2 Saving and Renewal of the Waveform Display Conditions (graph)