
Instruction Manual

4-6
IM 04L47B01-01EN
Display of tag information
Active tag information is displayed.
Procedure
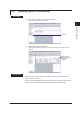
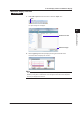
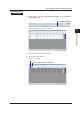
When a Y-axis tag is clicked on the waveform display screen, the tag information is
displayed in the properties window. For information on waveform display, see section 4.1.
When any tag is clicked, the tag information is displayed
Tag information
Adding groups
Procedure
1.
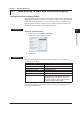
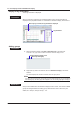
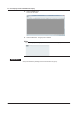
While in waveform display, click Edit > Append Group on the menu bar.
A tab with a new group name is created in the active waveform display screen.
Existing waveform display screen
With newly added group
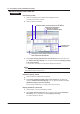
2.
Right-click any data in the data list, then click Additional display in the active
window.
The data is displayed as waveforms in the tab of the new group name.
Note
If you add a new group and then click another group tab without displaying any new waveforms
in the added group, the added group tab disappears. You can add the group again to display it.
Explanation
Groups can be added when the waveform display screen is shown. The names of added
groups are assigned based on existing group names and the order in which they are
added, as in: Group1, Group2, Group3, …etc.
4.1 New Display of Data and Additional Display