
Instruction Manual

4-1
IM 04L47B01-01EN
1
2
3
4
5
IndexIndex
Data Display Methods
4.1 New Display of Data and Additional Display
Setting the waveform display method
Before displaying data as a waveform, set the waveform display method. After setting the
display method and displaying waveforms, the waveforms appear in the specified display
format. After displaying waveforms, you can also change and save the display method.
Even if the waveform display method is set, when displaying a graph (see section 4.2)
the display method saved with the graph takes precedence.
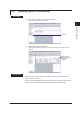
Procedure
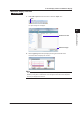
Setting the waveform display
1.
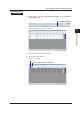
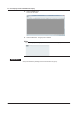
On the menu bar, click Display > Set default.
The [Set Display Default] dialog box is displayed.
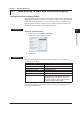
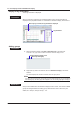
2.
Set each item.
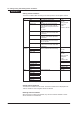
Explanation
Waveforms are displayed according to the specified conditions. The contents of the
setting items are as follows.
Setting item Description
Grid color Waveform grid color
Background color Waveform background color
Tag display Channel name/Tag name/Tag No.
Thickness of wavy line Normal/Middle/Thick
Cursor value Display/No Display
Transparency of cursor value Translucence/Opacity
Cell without value Padding/Not padding
Sets whether to fill cells without values or to
leave them blank. Cells without values are
filled in with previous values (event data) or
subsequent values (display data).
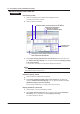
After waveform display you can change the default settings, but the waveform display
prior to the change will remain.
Chapter 4
Data Display Methods