
Instruction Manual

1-5
IM 04L47B01-01EN
1
2
3
4
5
IndexIndex
Outline of DAQManager
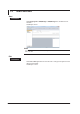
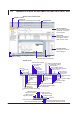
Digital value display
• Can be displayed in units of groups. Up to 50 groups can be displayed.
• Up to 100 tabs of waveforms can be displayed per group.
• Display/No display can be selected for alarms.
• Optional tags can be added and displayed.
• Two cursors are displayed.
• Active tags can be switched.
• The cursor range or the entire range can be converted to Excel or text.
• The cursor range or the entire range can be printed.
• Text strings can be copied to the clipboard.
• The cursor is linked with waveform and alarm displays.
Alarm Display
• Alarm occurrence time, alarm type, alarm status, and tag name are displayed.
• The cursor is linked with the waveform display.
• The cursor range can be printed.
• The cursor range can be converted to Excel or text.
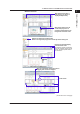
Mark/Message Display
• Mark/message text strings and the time are displayed.
• The cursor is linked with the waveform display.
• The cursor range can be printed.
• The cursor range or the entire range can be converted to Excel or text.
Cursor Control
• Display is made in group units. A maximum of 50 groups can be displayed.
• Cursor values can be displayed for a maximum of 100 tags per group.
• The values for cursor A and cursor B and the difference are displayed.
• Printing is possible.
• Cursor values can be set to Translucent, Opacity, or No display.
Section Calculation Display
• Display is made in group units. A maximum of 50 groups can be displayed.
• The section calculation results for a maximum of 100 tags can be displayed per group.
• At the time of show cursor, the cursor section is calculated, and at the time of hide
cursor, the entire section is calculated.
•
Min. value, max. value, P-P value, mean value, and time are displayed.
• Printing is possible.
• Results of statistical computation over and area can be copied to the clipboard.
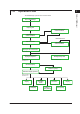
1.1 Overview of Functions