User’s Manual DXA250 DAQManager IM 04L47B01-01EN 4th Edition
Thank you for purchasing DAQManager. This user’s manual explains the operating procedures of the DAQManager software. To ensure correct use, please read this manual thoroughly before beginning operation. After reading the manual, keep it in a convenient location for quick reference whenever a question arises. Adobe Reader 7 or later by Adobe Systems Inc. is required to view the manual. Notes Trademarks Revisions • The contents of this manual are subject to change without prior notice.
How to Use This Manual Structure of the Manual This User’s Manual is composed of the following chapters 1 to 5 and an index. Chapter 1 Title Outline of DAQManager 2 File Management Functions Data Search Function 3 4 Data Display Methods 5 Troubleshooting Index Content Explanation of the Outline of DAQManager The personal computer environment required for use of DAQManager, the system structure, the operation flow of DAQManager, the start and end procedure, etc. are explained.
Revision Information 1 Title Manual No. 2 Edition 1st Edition 2nd Edition 3rd Edition 4th Edition : DXA250 DAQManager User’s Manual : IM 04L47B01-01EN Issued date May 2009 August 2009 March, 2010 June, 2010 Revision information, software release number Newly published, R1.01 Corrections, and additions of descriptions. R1.02 Added new functions, support for DXAdvanced R4 (/AS1 function not supported). R2.01.01 Added support for Windows 7, restrictions, and caution items. R2.02.
Contents How to Use This Manual.................................................................................................................... ii Revision Information......................................................................................................................... iii Chapter 1 Outline of DAQManager 1.1 1.2 1.3 1.4 1.5 Chapter 2 File Management Functions 2.1 2.2 2.3 2.4 Chapter 3 iv File Import and File Export . .......................................................
Contents Display of tag information .................................................................................................... 4-6 Adding groups....................................................................................................................... 4-6 Deleting groups..................................................................................................................... 4-7 4.2 Saving and Renewal of the Waveform Display Conditions (graph) ...............................
Contents Index vi IM 04L47B01-01EN
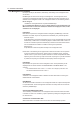
Chapter 1 Outline of DAQManager 1.1 Overview of Functions 1 In this manual, DXAdvanced (DX1000/DX1000N/DX2000), DX364, DX100/DX200, MVAdvanced (MV1000/MV2000), and FX100 are represented as recorder. Recorder (DX100/DX200/DX1000/DX1000N/DX2000/MV1000/MV2000) Personal computer with DAQManager installed Media Folder Management area File import File export Search and display DAQManager Display by viewer DAQSTANDARD viewer DAQEXPLORER viewer* * The DAQEXPLORER Viewer version 4.
1.1 Overview of Functions File Management Functions File import, file export, file deletion, data backup, and editing of the management area can be done. DAQManager has areas for file saving and management. The management area is composed of a management folder for saving of data files and index information for all data files in the management folder. The management folder is at the following location. Never change it.
1.1 Overview of Functions List Display Function 1 Outline of DAQManager Lists of tags, alarms, display groups, messages, files and continuous data are displayed. Waveform display is made in specified data sets or entire file, and specified data can be added to an existing waveform display screen. Data displayed as waveforms can be displayed as digital values. Lists can be sorted in the order of the displayed items. The list display types are shown below.
1.1 Overview of Functions Data Search Function List Search Function Restricted search for a displayed list is possible by specifying a text string or a time period. • Search with specification of a time period “None”, “Date and time”, “Last xx Hour”, “Last xx Day”, “Last xx Month”, and “Last xx Year.” For [Date and time], enter a start and end date/time for the search period. • Search with specification of a text string When a text string is specified, the object item differs according to the list type.
1.1 Overview of Functions 1 Digital value display Can be displayed in units of groups. Up to 50 groups can be displayed. Up to 100 tabs of waveforms can be displayed per group. Display/No display can be selected for alarms. Optional tags can be added and displayed. Two cursors are displayed. Active tags can be switched. The cursor range or the entire range can be converted to Excel or text. The cursor range or the entire range can be printed. Text strings can be copied to the clipboard.
1.1 Overview of Functions Print Function Waveforms, digital values, alarm values, marks/messages, cursor values, and calculation results can be printed. Printing is not possible for the list display of search results. Waveform Printing Printing is possible when the waveform screen is active. However, when tags for 11 or more axes are displayed on the same screen, Y-axis printing is not possible from the tenth axis on.
1.1 Overview of Functions Other Functions 2 3 • DXAdvanced (DX1000/DX1000N/DX2000) display data files (extention: .dad) and event data files (extention: .dae) • DX364 display data files (extention: .dad) and event data files (extention: .dae) • DX (DX100/DX200) display data files (extention: .dds) and event data files (extention: .dev) • MVAdvanced (MV1000/MV2000) display data files (extention: .dad) and event data files (extention: .dae) • FX100 display data files (extention: .
1.2 Required System Environment OS (operating system) The following operating systems can be used.
1.2 Required System Environment 1 Printer/Mouse Devices compatible with the OS are required. Do not change the time zone for a personal computer using DAQManager. The operation is not normal when the time zone is changed. If change is required, reconstruct the management area. Waveforms also is not displayed normally when a backup of the management area is restored to a personal computer with a different time zone. In this case, normal operation is also obtained by reconstruction.
1.3 Start and Exit Start Procedure Select All programs > DAQManager > DAQManager from the Start menu of Windows. DAQManager will start. Note The search results at the time when DAQManager was ended the last time are not restored after a new start. Exit Procedure Select File > Exit application from the menu bar or click [x] at the right end of the title bar of the window. DAQManager is closed.
1.4 Operation Flow 1 Outline of DAQManager The DAQManager operation flow is shown below. 2 Start of DAQManager Refer to section 1.3. 3 Importing files Saving and reading of search conditions Refer to Section 2.1. 4 Refer to Section 3.2. Specification of search conditions Refer to Section 3.2. 5 Restricted search Search execution Specification of search conditions Refer to Section 3.2. Index Refer to Section 3.2. Display of the search results Refer to Section 3.1.
1.5 Names of Parts on the Main Screen and their Use Names of the window parts Navigation window Drawing pin The window is minimized when this is clicked. Search window Search setting area Setting of search conditions, search start, and saving of search conditions. Data list area Display of data selected in the navigation window or display of search results. Properties window The properties of selected data are displayed. Types displayed in the navigation window Select by clicking.
1.
1.5 Names of Parts on the Main Screen and their Use When an independently displayed window is dragged onto a guide arrow, the window relocation target is displayed in blue, and when it is dropped, the window is pasted to the blue display part Drawing pin and minimized display When the drawing pin is clicked, the window display is minimized. When a minimized window is clicked, it returns to the original display, and it is fixed when the drawing pin is clicked.
1.5 Names of Parts on the Main Screen and their Use 1 Navigation window display example Outline of DAQManager Drawing pin Clicking here minimizes the window. All imported data types 2 Imported equipment name The serial No. of the equipment and the equipment name are displayed. The equipment name can be changed by right-clicking and selecting “Change name.” All imported equipment data types 3 4 When an item is clicked, the object data are displayed in the list window.
1.
1.5 Names of Parts on the Main Screen and their Use 1 Properties window display example Outline of DAQManager Properties of the data selected in the list window 2 The display frame is enlarged/reduced by dragging the spreader display Clicking here displays the lower level 4 The lower level is closed by clicking here Window spreader display example A display example for the spreader displayed when the mouse cursor on the main screen is moved to a window boundary is shown below.
Chapter 2 2.1 File Management Functions File Import and File Export 1 Manual file import 2 Procedure File Management Functions Manual import [Folder specification] 1. Click the manual import [Folder specification] icon or select File > Manual 3 import > Folder from the menu bar. Manual import [folder specification] 4 The “Browse for Forlder” dialog box is displayed. 5 Index 2. Specify a folder. 3. Click the [OK] button.
2.1 File Import and File Export Manual import [File specification] 1. Click the manual import [File specification] icon or select File > Manual import > File from the menu bar. Manual import [file specification] The “Open” dialog box is displayed. 2. Select a file and click the [Open] button. The file is copied to the management area.
2.1 File Import and File Export 1 Automatic file import Procedure Automatic import [Folder specification] 2 1. Click the automatic import settings icon or select File > Automatic import > File Management Functions Folder specification from the menu bar. Automatic import settings 3 The “Automatic import folder setting” dialog box is displayed. 4 5 Index 2. Click the [Create] button. The “Browse for Folder” dialog box is displayed. 3.
2.1 File Import and File Export Deleting the import folder settings 1. Click the “No.” column of the imported folder. The folder becomes selected. 2. Click the [Delete] button. The folder registration is deleted. Immediate automatic import 1. Click the icon for immediate automatic import or select File > Automatic import > Execute immediately from the menu bar. Immediate automatic import Import is performed immediately from the folder specified as the import source.
2.1 File Import and File Export Immediate automatic import Changing the imported equipment name Procedure 1 2 File Management Functions Import from the folder set by automatic import [Folder specification] is performed immediately. When immediate automatic import operation is performed, the set management folder is confirmed and any not yet imported files are imported. When this is during automatic import, the import is aborted and new import is performed.
2.1 File Import and File Export File export Procedure 1. Click “File” in the navigation window and display the file list. Right-click any file and select “Export.” 2. Right-click any file and select “Export” or click any file and then select File > Export from the menu bar. The “ Browse for Folder” dialog box is displayed. 3. Select a folder and click the [OK] button. The file is exported. Explanation Files imported to the management area are exported to the specified folder.
2.2 Deleting data files or devices Deleting data files 2 The data file in the file list is deleted. Files shown in waveform display or as waveform display conditions (“Graph,” see section 4.2) cannot be deleted. 1. With the file list displayed, right click the data to be deleted and select “Delete” or click the data to be deleted and select Edit > Delete from the menu bar. File Management Functions Procedure 1 3 4 5 Index A confirmation message is displayed. 2. Click the [OK] button.
2.2 Deleting data files or devices Deleting a device A device can be deleted only when all files of the device have been deleted. Procedure 1. Display the file list of the device to be deleted and delete all data files. Execute “Data file deletion.” All data files are moved to “Deleted data” of the navigation window. 2. Click “Deleted data” of the navigation window and then select Edit > Empty deleted data from the menu bar. A confirmation message is displayed. 3. Click the [OK] button.
2.3 Editing the management area 1 With backup copying of the management area. the data files, the index file (file required for file searching), the graph information, and the display state settings in the management area which is the backup object are copied to the specified folder. The size of the index file can be confirmed on the edit screen (index size) of the management area. When this index file becomes large, file import may become impossible.
2.3 Editing the management area Creating a new management area Procedure 1. Select File > Management area information from the menu bar. The “Management area” screen is displayed. Note Please close all waveform display screens when editing the management area. 2. Click the [Create] button. The “Create” dialog box is displayed. 3. Enter the name of the management area and click the [OK] button. The name of the management area is displayed in the list.
2.3 Editing the management area 1 Changing the name of a management area Procedure 1. Select File > Management area information from the menu bar. 2 The “Management area” screen is displayed. File Management Functions 3 4 5 2. Click the No. of the management area name to be changed. 3. Click the [Change] button. The “Change” dialog box is displayed. Index 4. Enter the new name and click the [OK] button. The name is changed. Explanation The name of the management area is changed.
2.3 Editing the management area Management area switching Procedure 1. Select File > Management area information from the menu bar. The “Management area” screen is displayed. 2. Click the No. of the management area to be switched. 3. Click the [Switch] button. The “Switch” dialog box is displayed. 4. Specify the management area to be switched and click the [OK] button. A confirmation message is displayed. 5. Click the [OK] button. The management area is switched.
2.3 Editing the management area 1 Deleting a management area Procedure 1. Select File > Management area information from the menu bar. 2 The “Management area” screen is displayed. File Management Functions 3 4 5 2. Click the No. of the management area to be deleted. 3. Click the [Delete] button. The “Delete” dialog box is displayed. Index 4. Confirm the management area to be deleted and click the [OK] button. A confirmation message is displayed. 5. Click the [OK] button.
2.3 Editing the management area Confirming the size of the management area Procedure 1. Select File > Management area information from the menu bar. The “Management area” screen is displayed. 2. Click the No. of the management area for which the size is to be confirmed. 3. Click the [Calculate] button. The “Calculate” dialog box is displayed. 4. Click the [Execution] button. The calculation result is displayed in the management area size column.
2.3 Editing the management area 1 Making a backup copy of a management area Procedure 1. Select File > Management area information from the menu bar. 2 The “Management area” screen is displayed. File Management Functions 3 4 2. Click the No. of the management area for which data backup is to be performed. 5 3. Click the [Backup] button. The “Backup” dialog box is displayed. Index Click here 4. Click the button on the right side of the backup destination text input box.
2.3 Editing the management area 7. Click the [OK] button. The backup data are saved in the specified folder. Note When the free capacity of the specified folder is not sufficient, the message “Insufficient capacity for backup” is displayed. Secure the capacity or specify a different folder. Explanation The data of the selected management area are copied to the specified folder.
2.3 Editing the management area 1 Reading backup data Procedure 1. Select File > Management area information from the menu bar. 2 The “Management area” screen is displayed. File Management Functions 3 4 5 2. Click the [Restore] button. The “Restore” dialog box is displayed. Index 3. Click the button on the right side of the backup destination text input box. The “Browse for Folder” screen is displayed. 4. Select the backup data folder to be read in and click the [OK] button.
2.3 Editing the management area 6. Click the [OK] button. The restored management area is added. All read in backup data are copied to the management area. Explanation The backup data created by data backup are read in. The management area is given a name when the data are read in. When backup data are read in all backup data are copied to the management folder. The restored management area is added to the “Management area” dialog box.
2.3 Editing the management area 1 Data consistency check Procedure 1. Select File > Management area information from the menu bar. 2 The “Management area” screen is displayed. File Management Functions 3 4 5 2. Click the No. of the management area to be checked. 3. Click the [Check consistency] button. The “Check consistency” dialog box is displayed. Index 4. Click the [OK] button. A message is displayed. 5. Click the [OK] button. A consistency check is performed.
2.3 Editing the management area Reconstructing the management area When an error is caused with a consistency check of the management area, reconstruction is performed. Note Do not change the time zone for a personal computer using DAQManager. The operation is not normal when the time zone is changed. If change is required, reconstruct the management area. Waveforms are also not displayed normally when a backup of the management area is restored to a personal computer with a different time zone.
2.4 Setting summer time 1 When searching for data with summer time setting of the DXAdvanced unit, the MVAdvanced unit, and the FX100 unit search can be performed with application of summer time to the time of the imported files. 2 File Management Functions Procedure 3 1. Select File > DST setting from the menu bar. The “DST setting” dialog box is displayed. 4 5 2. Check one of the check boxes “Do not use DST”, “Use the DST setting of the OS”, and “Set DST.” 3.
Chapter 3 3.1 Data Search Function Data List Display 1 When data are searched, a list of the object data is displayed in the search folder. The imported files are taken under management and they are classified automatically by devices. The classified files are displayed as lists when an item is selected in the navigation window or as graph lists when graph is selected. 2 3 List display 1. Select “Data” in the navigation window or select View > Data from the menu bar.
3.1 Data List Display 3. Select the list display type. The data list is displayed. When all imported files are made search objects, select items from “All data” or lower When any item is clicked, the data are displayed as a list Search object data list Select data and display a waveform For details, see “4.1 New Creation of Data and Additional Display.” 4. Select any data.
3.1 Data List Display 1 Explanation The categories of data in the navigation window are as follows. You can sort by category by clicking the display contents item name. The order of items can be changed by dragging. View/hide of items also can be set. See “1.5 Names of Parts on the Main Screen and their Use.” Data types Tag Alarm Message File Continuous data 3 Data Search Function Group No. Display contents Tag name, tag No.
3.2 Setting, Saving and Deleting Search Conditions Search conditions for data or waveform display conditions (flag) can be set, saved, and deleted. Procedure 1. Import files. For the operation procedures, see “2.1 File Import and File Export.” 2. Select the type of list display to be searched from the navigation window. The data are displayed in the data list area. The data list is displayed when a search object is clicked Data list Restricting the search conditions 3.
3.2 Setting, Saving and Deleting Search Conditions 1 Saving search conditions 1. Click the [Save the cond.] button after setting the search conditions. The “Save the search cond.” dialog box is displayed. 2 3 2. Enter the name of the search conditions and click the [OK] button. Clicking here displays the search conditions list 4 Search conditions list 5 Index Renaming the search conditions 1. Right-click the search conditions. 2. Select [Change name].
3.2 Setting, Saving and Deleting Search Conditions Explanation Setting search conditions The search conditions differ according to the data specified in the navigation window. Search type Time None Date and time Relative time Last 1 hour Last 1 day Last 30 days Last 365 days String to be searched Alarm * Tag name Tag No.
3.3 Reading Search Conditions 1 Procedure 2 1. Click “search conditions” of the navigation window. The list of search conditions is displayed. 3 Data Search Function 4 Click here 5 Index 2. Double-click any search conditions. Search is performed according to the saved search conditions and the search result is displayed.
Chapter 4 4.1 Data Display Methods New Display of Data and Additional Display 1 Setting the waveform display method Before displaying data as a waveform, set the waveform display method. After setting the display method and displaying waveforms, the waveforms appear in the specified display format. After displaying waveforms, you can also change and save the display method. Even if the waveform display method is set, when displaying a graph (see section 4.
4.1 New Display of Data and Additional Display Waveform display from a data list Procedure New display of data 1. Click any list display type of “Data” of the navigation window. List display is performed for the data. 2. Click any data in the data list.
4.1 New Display of Data and Additional Display 1 Explanation New waveform display A new waveform window is displayed. Even if the same data already are displayed as waveform, waveform display is made in a new window. 2 Additional waveform display Display entire file Waveform display is made not only for the selected data, but also for the entire file including these data. At this time, the time axis becomes the start/stop time instead of file units.
4.1 New Display of Data and Additional Display State with waveform display of display group data View menu items Display Display entire file Additional display in the active window State with waveform display One waveform window is displayed, and the selected groups are displayed by groups. The files including the selected groups are displayed. Waveform windows are displayed for the number of files including groups. Groups in the same file are displayed in the same window.
4.1 New Display of Data and Additional Display 1 Waveform display from files Procedure 1. Select File > Open from the menu bar or click the “Open” icon. 2 Open 3 The “Open” dialog box is displayed. 4 Data Display Methods Select the file name 5 Index Select the file type 2. Click the [Open] button after specifying the file type and the file name. The selected data are displayed as waveform.
4.1 New Display of Data and Additional Display Display of tag information Active tag information is displayed. Procedure When a Y-axis tag is clicked on the waveform display screen, the tag information is displayed in the properties window. For information on waveform display, see section 4.1. When any tag is clicked, the tag information is displayed Tag information Adding groups Procedure 1. While in waveform display, click Edit > Append Group on the menu bar.
4.1 New Display of Data and Additional Display 1 Deleting groups Procedure 1. On the menu bar, click View > General Display Settings, or click the General 2 Display Settings icon. General Display Settings 3 The General Display Settings dialog box appears. 4 Data Display Methods 5 Index 2. Click the group tab that you wish to delete. 3. Click the No. column header. All channels are selected.
4.1 New Display of Data and Additional Display 4. Click the Delete button. All channels are deleted. 5. Click the OK button. The group tab is deleted. Note If you delete a group, the next group that is added is shown without a group name. Explanation Groups are deleted by deleting all the channels within the group.
4.2 Saving and Renewal of the Waveform Display Conditions (graph) 1 Save the waveform display conditions. The DAQManager file menu calls the waveform display conditions “Graph.” 2 Saving the display conditions 3 Procedure 1. With waveform display, click “Graph” of the navigation window. The waveform display conditions list is displayed. When no waveform display conditions have been saved, nothing is displayed in the list.
4.2 Saving and Renewal of the Waveform Display Conditions (graph) When Save graph as… has been selected 3. Change the graph name in the “Save graph as…” dialog box and click the [OK] button. The display condition file name is displayed in the graph list as list display. Redraw with the saved display conditions Double-click any display conditions name from the waveform display conditions list. Redraw the graph is performed with the saved display conditions.
4.
4.4 Waveform Detail Settings Procedure 1. Select View > General Display Settings from the View menu bar or click the “General Display Settings” icon. The “Genral Display Settings” dialog box is displayed. Click the tab of the group to be set Select by clicking the waveform No.
4.4 Waveform Detail Settings Zone (display position) The input range is as shown below. • Minimum value: 0 to 99 % • Maximum value: 1 to 100 % The waveform display position is set with the lower edge of the waveform display area of the waveform display screen as 0 % and the upper edge as 100 %. When the zone display area is clicked, numerical input becomes possible. When the Y-axis mode setting is “Y-axis free mode”, display is made with the set zone.
4.5 Changing the Waveform Display Zoom in / zoom out time axis Procedure 1. Select Time Axis > Zoom in, Zoom out, or Time axis Form to from the menu bar or click the “Zoom in” icon, the “Zoom out” icon, or the “Time axis specification display” icon. When time specification is selected, the “Trend display section specification” dialog box is displayed. 2. Set the date and time to be displayed. The set section is displayed as waveform display. 3. Set the time and the date.
4.5 Changing the Waveform Display 1 A grid of 1 hour/div or more shows the plotted time and time axis scale of contraction scale. Time axis contraction scale and grid position Grid position 00:00:00, 1:00, 2:00. ..., 23:00 0:00, 2:00, 4:00, 6:00, 8:00, 10:00, 12:00, 14:00, 16:00, 18:00, 20:00, 22:00 0:00, 3:00, 6:00, 9:00, 12:00, 15:00, 18:00, 21:00 0:00, 4:00, 8:00, 12:00, 16:00, 20:00 0:00, 6:00, 12:00, 18:00 0:00, 8:00, 16:00 0:00, 12:00 1st 00:00:00, 2nd, 3rd, ...
4.5 Changing the Waveform Display Y-axis display switching The Y-axis display has a Detailed mode and a Compact mode. The waveform display zone can be selected. The Y-axis width is adjusted automatically according to the number of display digits. Switching between Detailed mode and Compact mode The display state changes when the mouse cursor is moved or a button on the Y-axis is clicked. At that time, the Y-axis width is adjusted automatically according to the number of display digits.
4.5 Changing the Waveform Display Vertical movement of the Y-axis The operation examples for detailed mode are shown below. The same movement is also made in compact mode. Place the mouse cursor, and when it has become this mark, drag to move the Y-axis in vertical direction 1 2 3 4 Data Display Methods 5 Index Dragged state State when moved up Y-axis zoom in/zoom out The operation examples for detailed mode are shown below. The same operation is also performed in compact mode.
4.5 Changing the Waveform Display Setting examples for each zone are shown below. Example for Y-axis full mode Example for Y-axis auto mode Active tab Example for Y-axis slide mode Example for Y-axis free mode Y-axis grouping and cancellation Select Y-Axis > Grouping > Unit grouping, Unit scale grouping, or Cancel grouping, or click the following icon.
4.5 Changing the Waveform Display 1 Waveform display restrictions Select Y-Axis > Clip from the menu bar or click the following icon. Clip 2 Restriction of the waveform display range in Y-axis direction is possible from the minimum value to the maximum value set with “Scale” in the “General Display Settings” dialog box.
4.5 Changing the Waveform Display Moving trip lines A trip line can be moved by dragging & dropping the trip point numerical frame. Trip line 1 (red) Trip line 2 (blue) Trip line 3 (violet) Trip line 4 (orange) Alarm display ON/OFF Select View > Alarm from the menu bar or click the following icon to show/hide alarms on the waveform display screen.
4.6 Displaying Digital Values 1 You can display digital values of waveform-displayed tags in spreadsheet format. When displaying data of different intervals, the value of time for which there is no data is displayed as the previous value or the subsequent value. 2 Displaying digital values 3 Procedure 1.
4.6 Displaying Digital Values Explanation Displaying digital values Cursor and active channel switching is linked with waveform display and list display (alarm lists and mark lists). A mark icon is displayed at times for which there are marks or messages. The digital value display limit is 100 million data. (Waveform data exceeding 100 million data points cannot be displayed. The menu is invalid.) Time may be required for processing when displaying large quantities of data digitally.
4.7 Cursor Use 1 Cursor display/delete 2 Cursor display When any location is pointed at and dragged, a cursor is displayed at the position initially pointed at and at the dragged point. The cursor value of the waveform at the initial pointing location is displayed. Point the mouse on the screen (cursor A) 3 Drag the cursor (cursor B) 4 Data Display Methods Cursor value 5 Cursor deletion Index Select Edit > Erase cursor from the menu bar.
4.7 Cursor Use Changing Display/No Display of cursor values On the menu bar, click Display > Cursor Value, or click the cursor value display switching icon. (See the figure below, “Example of cursor values not displayed.”) The cursor value Display/No display setting is saved in the waveform display conditions (graph). Changing the cursor value transparency You can set the transparency used when displaying cursor values. The transparency setting is saved with the waveform display conditions (graph).
4.7 Cursor Use 1 Adding a mark 1. Point with the cursor 2. Click here (select Edit > Append mark from the menu bar) 3. Set mark Display/No display, Display position, Group, Title, and Comment then click [OK] 2 3 No display Display/No display switching Display position: Left When a mark is double-clicked, the “Append mark” dialog box is displayed and edition can be done Display position: Right Marks added with DAQManager are displayed in green. Marks added with the recorder are displayed in orange.
4.7 Cursor Use Search for alarm change points, mark/message positions, and start/stop Select Edit > Search Alarm, Search Mark, or Search Start/Stop from the menu bar. Search for an alarm change point Click any one Search for a mark/message position Click any one Search for a start/stop position Click any one Search for an alarm change point Move cursor A or cursor B to an alarm change point (alarm occurrence point/recovery point from an alarm occurrence state) of an active channel.
4.8 Alarm List/Mark List Display 1 Alarms and marks are displayed as lists when a display file/event file is open. 2 Procedure 1. Select Window > Alarm/Mark from the menu bar or click the “List” icon. List 3 2. Click the alarm list tab. The alarm list screen is displayed. Click here Data Display Methods 4 Sorting is done when each item is clicked 5 Cursor range Index 3. Click the mark list tab. The mark list screen is displayed.
4.9 Data Format Conversion Excel or text conversion can be performed on data being displayed, or on files. Also, watch folder data can be converted to Excel or text upon import (automatic conversion). The file header (file message and batch information) is included in the conversion. Procedure Converting displayed waveform data 1. On the menu bar, click Convert > Excel conversion, or Text conversion, or click the [EXCEL conversion] or [text conversion] icon.
4.9 Data Format Conversion Data conversion by file 1. In the navigation window, click [File], then select the files you want to convert to 1 data. Multiple files can be selected at once. 2 2. On the menu bar, click Convert > To Excel[File] or To Text[File]. The To Excel[File] or To Text[File] dialog box is displayed. To Excel[file] dialog box To Text[File] dialog box 3 4 Data Display Methods Browse button 3. Set the number of steps and folder for the data to convert.
4.9 Data Format Conversion Explanation If the data targeted for conversion that is being waveform displayed has multiple intervals and no values, you can specify to use nearby data to fill it in, or to leave it blank. Event data is filled in with previous values, and display data is filled in with subsequent values. For [Cell without value] in the conversion dialog box, set [Padding] or [Not padding].
4.9 Data Format Conversion Specifications for Excel conversion by file, and automatic Excel conversion of watch data Item Format Channel specification File name Datafilename.
4.9 Data Format Conversion Conversion format for data being displayed as waveforms If cursors are displayed, only the data in the cursor range is converted. Conversion format when tags of multiple files are displayed 1 2 3 4 5 6 7 8 DAQManager Rx.xx.xx Graph name Start time Stop time Group name 9 10 11 12 13 14 Date 2009/3/25 2009/3/25 Graph 3 2009/3/25 2009/3/25 Group 01(01) Time 18:23:39 18:23:40 18:23:39 18:23: 40 0.000 0.000 Channel name Tag name Tag no. Unit Sec. 0.000 0.
4.9 Data Format Conversion Conversion format of data by file For Excel conversion, the Date cell takes date format, the Time cell takes time format, and the start and end times each take the date/time format. If the file is divided due to the restriction on number of rows, headers are added to all the files. Also, if the results are divided into multiple sheets within the file due to the restriction on the number of columns, headers are added to all the sheets. The format is described below.
4.9 Data Format Conversion DX/DXAdvanced/MVAdvanced (Batch function On) format 1 DAQManager Rx.xx.xx 2 3 4 5 6 7 8 9 10 11 12 13 14 15 16 17 18 19 20 21 22 23 40 41 42 43 44 45 46 47 48 49 50 51 Batch name File header Instrument type Serial No. Batch No.+Lot No. HEADER DX200 SERIAL_300 Time Correction Start time End time Start Cond. End Cond.
4.9 Data Format Conversion Conversion format for alarm lists The conversion format for alarm lists is the same as that for the data conversion of displayed waveforms or data conversion by file. If cursors are displayed, only the data in the cursor range is converted. Alarm list conversion example 1 2 3 4 5 6 Status ON ON OFF OFF ON Tag name ato5 ato5 ato5 ato5 ato5 Tag no.
4.10 Data Printing Printer setting Procedure 1. Select File > Print Settings from the menu bar. The “Print Settings” dialog box is displayed. 2. Set the items by selecting from the list box or by input into a text box. Explanation The active screen (waveform display screen, alarm list, mark/message list) is printed. The display of alarm lists and mark/message lists is switched by tabs, and the displayed list is printed. The print setting items and the contents are as shown below.
4.10 Data Printing Printing digital values Headers are added before printing. For single batches, the same headers are added as for waveforms. If printing extends for multiple pages, headers are added to all pages. The restriction on printing digital values is up to 5 million data. If 5 million data are exceeded, the print preview and print menus are disabled.
4.10 Data Printing Print preview Procedure The print layout can be seen before printing. 1. Select File > Print preview from the menu bar or click the “Preview” icon. Preview The preview screen is displayed. 2. Confirm the print layout. Note • • The print image for the specified range is displayed on the preview screen. See the instruction manual of the used system for the print preview operation. Printing Procedure 1. Select File > Print from the menu bar or click the “Print” icon.
4.11 Handling of Data for which the Time has been Changed When the time of data has been changed, handling is performed as the same tag and handling as a different tag is done at the time change point. Channel names, tag names, and tag designations are displayed on the waveform display screen with consecutive numbers added.
Chapter 5 Troubleshooting 5.1 Messages and Handling Methods 1 Messages may be displayed on the screen during use. The contents and the handling methods are explained in the following. No. M10001 M10002 M10004 Delete instrument. OK? M10005 Normal exit has been made. M10006 Switch management area. OK? M10007 Delete management area. OK? Search information and all imported files will be deleted. M10008 A consistency check will be performed. OK? This processing may require some time.
5.1 Messages and Handling Methods No. W10102 Display contents The corresponding instruments have reached the upper limit. Explanation As the number of devices which can be managed has reached the upper limit, no new device files can be imported. W10105 The upper limit of tags for which waveform display is possible has been exceeded. Additional display is not possible for a part. As the upper limit for display in the same view is 100 tags, no further additional display is possible.
5.1 Messages and Handling Methods 1 Error messages No. – Display contents Insufficient memory. Restoring of management area failed. E10202 File could not be opened. Too many files have been selected. E10203 E10204 This folder cannot be selected. E10205 This folder already has been selected. An error has occurred during processing. E10206 E10207 This is displayed when a folder other than the backup folder has been specified for management information or when the backup data are not normal.
5.1 Messages and Handling Methods No. E10216 E10219 Display contents Access to the management area was not possible. A fatal error has occurred. Restart the application. An error has occurred during conversion processing. File export failed. E10220 Processing has failed. E10217 E10218 5-4 Explanation This is displayed when access to the management area was not possible. Handling method Check access restrictions to the management area. This is displayed when operation has become impossible.
5.2 Displaying a Log File 1 Log files are created at the time of file or folder import. When a file which should have been imported is not displayed, the reason why it was not imported is listed. 2 Log files are at the following location. \Yokogawa Electric Corporation\DAQManager\LOG 3 : Name of the directory where DAQManager is installed Log file name :import_YYYYMMDD.log YYYY MM DD 4 : Four-digit year : Month : Day 5 File format: Date and time, No.
5.3 DAQManager Restrictions and Caution Items Upper limit for the index size for the management area The upper limit for the index size is 2 Gbyte. Approximately 100,000 files can be handled with an index file of 2 Gbyte. However, the number of files which can be handled changes according to the number of alarms etc. The index size can be confirmed on the management area edit screen.
5.3 DAQManager Restrictions and Caution Items Power-save settings Set the PC so that it will not enter power-save mode while you are using DAQManager. If the PC enters power-save mode while files are being imported, inconsistencies will arise in the file management area. If this problem occurs, reconstruct the file management area.
Index Index A adding a mark........................................................................ 4-25 adding an optional mark........................................................ 4-25 adding groups.......................................................................... 4-6 additional display in the active window.................................... 3-2 additional display of data......................................................... 4-2 additional waveform display..................................
Index G general display settings.................................................. 4-7, 4-12 graph....................................................................................... 4-9 grid.........................................................................................4-11 group..................................................................................... 4-12 H help........................................................................................ 1-12 I identifier.............
Index V 1 vertical movement of the Y-axis............................................. 4-17 W 2 warning messages.................................................................. 5-1 watch folder...................................................................... 1-2, 2-4 watch folder data conversion................................................... 1-2 waveform additional display.................................................... 4-2 waveform detail settings.......................................