
User Manual
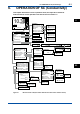


<6. OPERATION OF SC (Conductivity)>
6-10
IM 12A01A02-01E 5th Edition : Oct. 31, 2013-00
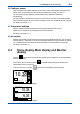
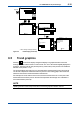
Read Logbook:
logbook1-1
Memorandum:
Item
Sensor washed by hand
Enter?
No
logbook1-1 1/1
Memorandum:
Item
Sensor replaced
Enter?
No
2010/02/15 17:04
Sensor replaced
2010/02/15 15:15
Power on
Finish
2010/02/15 15:15
Power on
Finish
logbook1-1 1/1
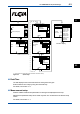
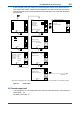
** When storing message manually.
**
(Fig.6.6)
Sensor washed by hand
Module replaced
Sensor replaced
logbook1-1
logbook1-2
No
Yes
Figure 6.8 Detail display (continued)
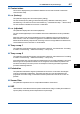
6.5 Trend graphics
Pressing on the Zoom display changes the display to a graphical mode in which the
average measured value is shown on a time scale. The “Live” value is also digitally displayed in
atextbox.Thetimescale(X-axis)andtheprimaryvaluescale(Y-axis)aresetinthe“DISPLAY
SETUP”menu(Section7.7.2).
The screen displays the trend of up to 41 averages of the measurement for each time interval.
The FLXA21 samples the measurements every second. The trending graphic also shows the
maximumandminimummeasuredvaluesinthatinterval.
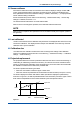
Forexample,ifthetimescaleissetto4hours,thenthetrendisshownfor4hourspriortothe
actualmeasurement.Eachpointonthetrendlinerepresentstheaverageover4×60×60/41=
351 measurements (seconds).
NOTE
Updatingthetrendscreensetupresetsthecurrenttrendgraphandstartsanewone.