
User Manual

<3. OPERATION OF pH/ORP>
3-11
IM 12A01A02-01E 5th Edition : Oct. 31, 2013-00
NOTE
Updatingthetrendscreensetupresetsthecurrenttrendgraphandstartsanewone.
12.00
8.40
5.60
2.50
12:00 12:20 12:40
10.38pH
Minimum
Maximum
Average
Time
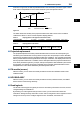
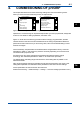
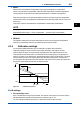
Tag:
Measurement value (pH)
FLXA21-PH
pH1
Current process value
Max. and min. values on this display
Figure 3.10 Trend screen
The 1st display item data on the Main display is shown as a graph. Touching any point on the
display changes the display to the 2nd display item data (and to the 3rd display item data if set)
and then returns to the Main display.
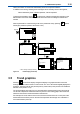
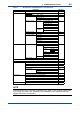
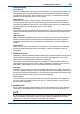
12.00
8.40
5.60
2.50
12:00 12:20 12:40
10.38pH
Tag :
FLXA21-PH
pH1
12.00
8.40
5.60
2.50
12:00 12:20 12:40
25.0°C
Tag:
FLXA21-PH
Temperature1
Next
20
12
4
mA
15.00
Figure 3.11 Trend graphics
3.6 Instrument status screen
In the eldoftheMaindisplay,the (Warning) or (Fault) sign appears according
totheinstrumentstatus.Uponpressingthedisplayedbutton,detailedinformationoftherelevant
status appears.
See “n Information button
” on page 1-7.
PH
3