
User Manual


<Appendix 4 For DO (Dissolved Oxygen)>
App.4-2
IM 12A01A02-01E 5th Edition : Oct. 31, 2013-00
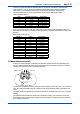
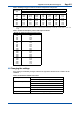
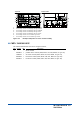
Table 2 Solubility of oxygen in water as a funstion of temperature and pressure
Temperature
(°C)
Pressure [kPa (atm) *
1
]
111.5 (1.1) 101.3 (1.0) 91.2 (0.9) 81.1 (0.8) 70.9 (0.7) 60.8 (0.6) 50.7 (0.5)
Solubillity (mg/l)
0.0
5.0
10.0
15.0
16.09
14.06
12.43
11.10
13.14
11.48
10.15
9.05
11.69
10.20
9.00
8.03
10.21
8.91
7.86
7.01
8.74
7.62
6.71
5.98
8.74
7.62
6.71
5.98
7.27
6.34
5.58
4.96
20.0
25.0
30.0
35.0
40.0
10.02
9.12
8.35
7.69
7.10
8.14
7.40
6.76
6.22
5.72
7.23
6.56
5.99
5.47
5.03
6.30
5.70
5.19
4.75
4.34
5.37
4.84
4.60
4.01
3.65
5.37
4.84
4.60
4.01
3.65
4.44
4.00
3.62
3.28
2.96
ISO 5814:1990(E)
*1: Unitsatstandardbarometricpressure(normalatmosphericpressureatsealevel):101.325kPa=101.325kN/m
2
=1atm=760
mmHg
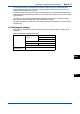
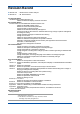
Table 3 Variation of atmospheric pressure with respect to altitude
Altitude (m) Mean atmospheric pressure (kPa)
0
100
200
300
400
101.3
100.1
98.8
97.6
96.4
500
600
700
800
900
1000
95.2
94.0
92.8
91.7
90.5
89.4
1100
1200
1300
1400
1500
88.3
87.2
86.1
85.0
84.0
1600
1700
1800
1900
2000
2100
82.9
81.9
80.9
79.9
78.9
77.9
ISO 5814:1990(E)
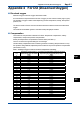
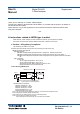
n Changing the settings
If any setting is accidentally changed, values to the right of the relevant arrow in Table 4 are all
initialized.
Table 4 Parameters that initialize other values
Sensortype-> Sensor sensitivity
Calibration settings: Limits and timing: Zero, Slope (low, high)
Output:Processparameter-> Linear: 0% value, 100% value
Table
Communication:HART:PV
TrendGraphScreen-> Y-axis(low,high)
Communication: HART
Conguresensor:Unit-> Trend:Y-axis:Limits:Oxygen(low,high)