
User Manual


<Appendix 2 For SC (Conductivity)>
App.2-8
IM 12A01A02-01E 5th Edition : Oct. 31, 2013-00
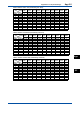
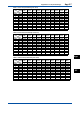
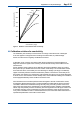
Table M HNO
3
35..80% (Conductivity unit: S/cm)
Solutions
(Conc.)
Temp.ranges
Solut.
Min.
Solu-
tion 2
Solu-
tion 3
Solu-
tion 4
Solu-
tion 5
Solu-
tion 6
Solu-
tion 7
Solu-
tion 8
Solu-
tion 9
Solut.
Max.
35 % 37.2 % 43.3 % 49.6 % 55.8 % 62 % 75 % 76.6 % 82 % 87.7 %
Tmin. -16˚C 0.412 0.400 0.368 0.334 0.288 0.254 0.163 0.147 0.0893 0.0439
2. 0˚C 0.576 0.5554 0.507 0.456 0.404 0.352 0.227 0.208 0.128 0.0596
3. 10˚C 0.678 0.666 0.614 0.555 0.493 0.438 0.268 0.246 0.153 0.0694
4. 18˚C 0.770 0.754 0.700 0.634 0.565 0.506 0.300 0.2769 0.172 0.0772
5. 20˚C 0.786 0.776 0.721 0.654 0.583 0.512 0.310 0.290 0.175 0.079
6. 25˚C 0.842 0.831 0.784 0.714 0.636 0.559 0.340 0.315 0.185 0.081
7. 30˚C 0.895 0.886 0.827 0.754 0.672 0.590 0.370 0.335 0.190 0.083
8. 40˚C 1.001 0.995 0.938 0.858 0.774 0.690 0.430 0.375 0.200 0.087
9. 50˚C 1.105 1.095 1.038 0.958 0.874 0.790 0.485 0.415 0.210 0.091
Tmax. 60˚C 1.205 1.195 1.138 1.058 0.974 0.890 0.530 0.455 0.220 0.095
Tref. 25.0˚C 0.842 0.831 0.784 0.714 0.636 0.559 0.340 0.315 0.185 0.081
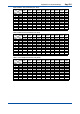
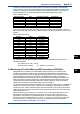
<User-denedmatrixes>
Theuser-denedtemperaturecompensationmatrixisamatrixdenedbyusers.Entervaluesas
shown in Table 3. The gray areas must be entered.
Table3 Exampleofuser-denedmatrix(Referencetemperature(Tref.):25.0˚C,Conductivityunit:S/cm)
Solutions
(Conc.)
Temp.ranges
Solut.
Min.
Solut.
Max.
Solu-
tion 2
Solu-
tion 3
Solu-
tion 4
Solu-
tion 5
Solu-
tion 6
Solu-
tion 7
Solu-
tion 8
Solu-
tion 9
0 % 15 % 1 % 3 % 4 % 5 % 6 % 8 % 10 % 12 %
Tref. (25.0˚C) 0 0.410 0.052 0.142 0.183 0.222 0.256 0.313 0.355 0.381
Tmin. 0˚C 0 0.215 0.035 0.087 0.113 0.133 0.150 0.176 0.195 0.206
Tmax. 100˚C 0 1.13 0.119 0.315 0.407 0.495 0.574 0.717 0.850 0.967
2. 10˚C 0 0.293 0.042 0.109 0.140 0.167 0.190 0.226 0.255 0.274
3. 18˚C 0 0.455 0.047 0.125 0.163 0.195 0.221 0.267 0.303 0.327
4. 25˚C 0 0.410 0.052 0.142 0.183 0.222 0.256 0.313 0.355 0.381
5. 30˚C 0 0.557 0.056 0.153 0.200 0.242 0.278 0.338 0.389 0.424
6. 40˚C 0 0.551 0.067 0.179 0.233 0.281 0.323 0.396 0.458 0.502
7. 50˚C 0 0.645 0.070 0.201 0.265 0.320 0.368 0.454 0.527 0.580
8. 60˚C 0 0.742 0.080 0.223 0.293 0.355 0.410 0.507 0.592 0.658
9. 80˚C 0 0.936 0.100 0.270 0.350 0.425 0.493 0.612 0.721 0.814
Note: Thistableisasshownonthescreen.Thegrayareasmustbeentered.
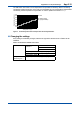
Set the reference temperature in the Temp. comp. screen (default: 25.0°C).
Input concentration values in the Solution screen.
ThevaluesmustbeenteredinascendingorderfromSolution(Min.)toSolution(Max.).Solution
(Min.)andSolution(Max.)mustbeentered.
Input temperatures for compensation in the Temp. ranges screen.
Inputtheconductivityvalues*atrespectivetemperaturesintheSolution(Min.)screenandthose
intheSolution(Max.)screen.Inputothervalues,ifany,intheSolutionnscreen.
*: Entertheprecompensatedconductivity.
Allcellsoftwouser-denedmatrixesareblankasadefault.Ifanycellsarenotblank,clearthem.
After entering all values, select “Check values?” to verify that there is no error.
Thisfunctionchecksifthematrixisconsistentlyincrementalordecremental.Ifanyerrorisfound,
itslocationisspecied.
Ifthereisnoerror,thematrixiscompensatedlinearlyandtheblanksofthetable(ifany)arelled.
Ifsomeareasareleftemptywithoutrunning“Checkvalues?”,a1st/2ndcomp.matrixerrorwillbe
issued.