
User Manual


<15. OPERATION OF SENCOM pH/ORP>
15-12
IM 12A01A02-01E 5th Edition : Oct. 31, 2013-00
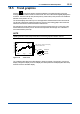
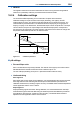
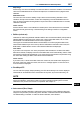
15.5 Trend graphics
Pressing on the Zoom display changes the display to a graphical mode in which the
average measured value is shown on a time scale. The “Live” value is also digitally displayed in
atextbox.Thetimescale(X-axis)andtheprimaryvaluescale(Y-axis)aresetinthe“DISPLAY
SETUP”menu(Section16.7.2).
The screen displays the trend of up to 41 averages of the measurement for each time interval.
The FLXA21 samples the measurements every second. The trending graphic also shows the
maximumandminimummeasuredvaluesinthatinterval.
Forexample,ifthetimescaleissetto4hours,thenthetrendisshownfor4hourspriortothe
actualmeasurement.Eachpointonthetrendlinerepresentstheaverageover4×60×60/41=
351 measurements (seconds).
NOTE
Updatingthetrendscreensetupresetsthecurrenttrendgraphandstartsanewone.
12.00
8.40
5.60
2.50
12:00 12:20 12:40
10.38pH
Minimum
Maximum
Average
Time
Tag:
Measurement value (pH)
SENCOM
pH1
Current process value
Max. and min. values on this display
Figure 15.10 Trend screen
The 1st display item data on the Main display is shown as a graph. Touching any point on the
display changes the display to the 2nd display item data (and to the 3rd display item data if set)
and then returns to the Main display.