
User guide
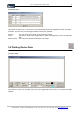
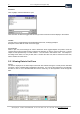
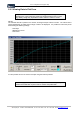
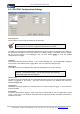
Table Of Contents
- Version: V2.7.1.2
- Contents
- 1 INSTALLATION and OVERVIEW
- 2DEVICE CONNECTION
- 3ENGINEERING RESOURCES
- 4MANAGING PROFILES
- 5MANAGING LOGGED DATA
- 6CONFIGURING DATALOGGERS
- 6.1 Introduction
- 6.2 DS-CPU3 Configuration
- 6.3 DS-4483 Configuration
- 6.3.1 DS-4483 Sensor Configuration Settings
- 6.3.1.1 Retrieving the Datalogger Configuration
- 6.3.1.2 Transferring Configuration Settings to the DS-4483
- 6.3.1.3 Loading a Template into iLink
- 6.3.1.4 Saving a Template to file
- 6.3.1.5 Printing Template Information
- 6.3.1.6 Sensor Selection
- 6.3.1.7 General Setup
- 6.3.1.8 I/O Setup
- 6.3.1.9 Scaling Setup
- 6.3.1.10 Timing/Misc Setup
- 6.3.1.11 Alarms Setup
- 6.3.1.12 Output Setup
- 6.3.1.13 Comment Setup
- 6.3.2 Telemetry Communications Control Configuration
- 6.3.4 New Sensor Wizard
- 6.3.1 DS-4483 Sensor Configuration Settings
- 7LOADING PROGRAMS
- 8DEVICE CALIBRATION
- APPENDIX A
- APPENDIX B
- APPENDIX C
- APPENDIX D
iQuest (NZ) Ltd - PO Box 15169 HAMILTON Tel: +64 7 957 8160 - Fax: +64 7 957 8162 - Email:
iLink - Configuration and Support Utility 33
iquest@iquest.co.nz
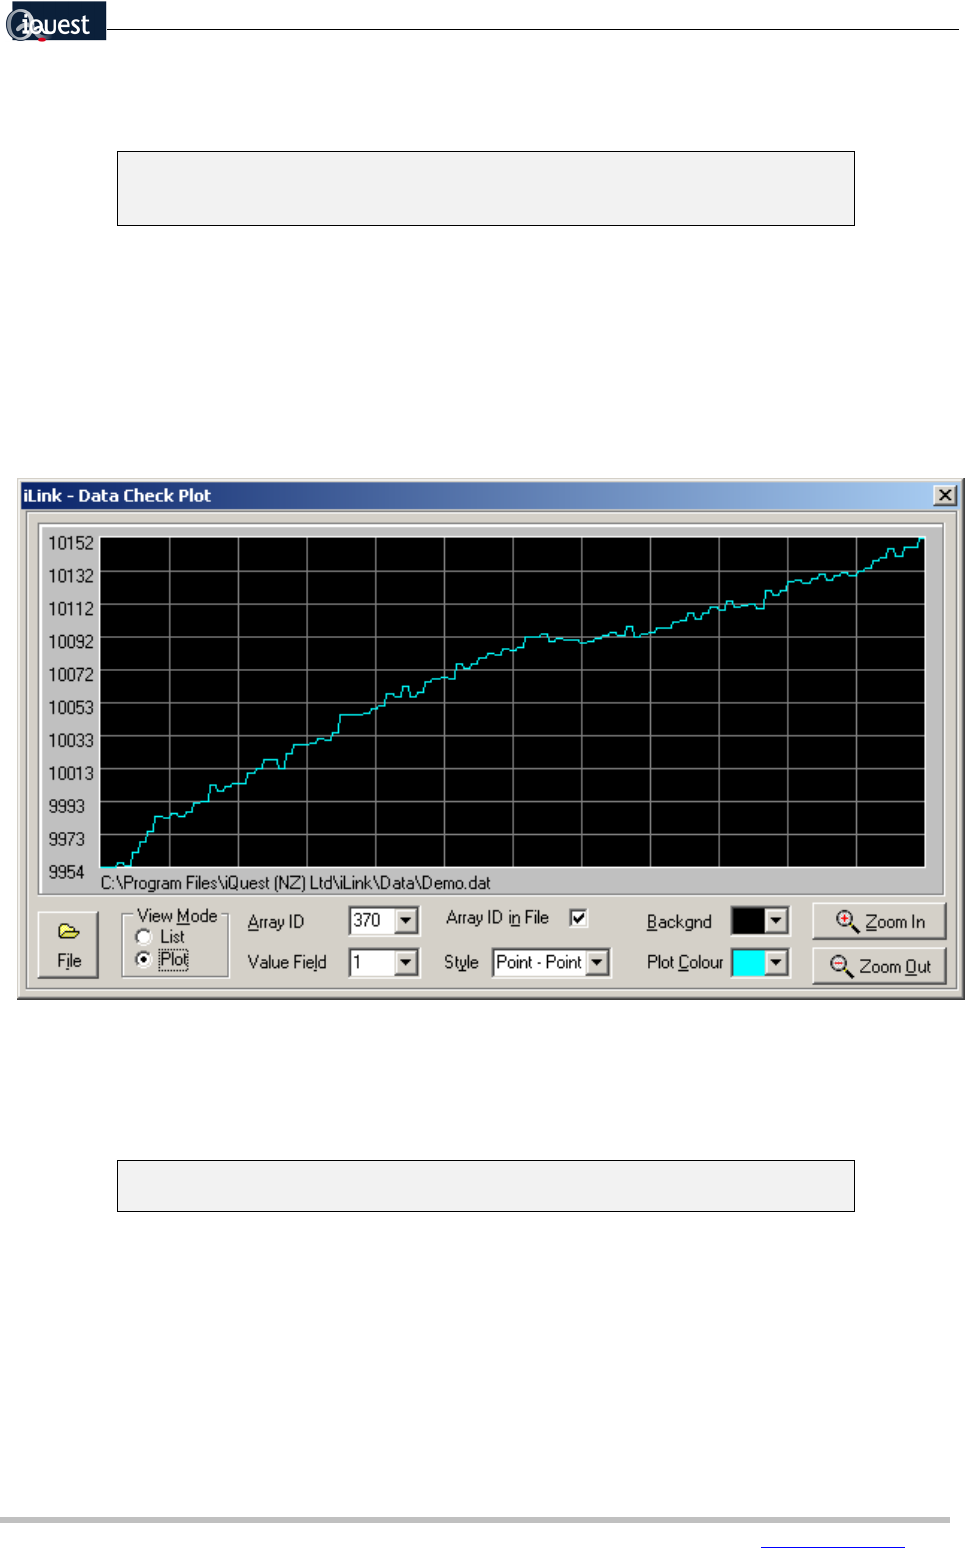
5.2.2 Viewing Data in Plot Form
The plots use the data values as stored in the logger that are integers.
Therefore, the Y-axis values may need to be interpreted with a factor in mind.
E.g. Battery voltage may be plotted as 1200 to 1500 for 12.00V to 15.00V
Plot view
The selected data file is plotted in the window, showing all sample values in the file. The vertical axis is
scaled appropriately to enable the full range of data to be displayed. It is possible to format the plot as
desired using the following settings:
Plot Style
Background colour
Plot colour
It is also possible to zoom in and out of the plot using the buttons provided.
When changing the Array ID, Field or Plot Style from the Plot View, you may
need to list the data then re-plot in order to “refresh” the plotted data.