
User guide
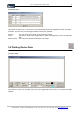
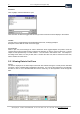
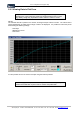
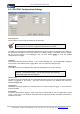
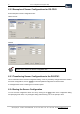
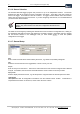
Table Of Contents
- Version: V2.7.1.2
- Contents
- 1 INSTALLATION and OVERVIEW
- 2DEVICE CONNECTION
- 3ENGINEERING RESOURCES
- 4MANAGING PROFILES
- 5MANAGING LOGGED DATA
- 6CONFIGURING DATALOGGERS
- 6.1 Introduction
- 6.2 DS-CPU3 Configuration
- 6.3 DS-4483 Configuration
- 6.3.1 DS-4483 Sensor Configuration Settings
- 6.3.1.1 Retrieving the Datalogger Configuration
- 6.3.1.2 Transferring Configuration Settings to the DS-4483
- 6.3.1.3 Loading a Template into iLink
- 6.3.1.4 Saving a Template to file
- 6.3.1.5 Printing Template Information
- 6.3.1.6 Sensor Selection
- 6.3.1.7 General Setup
- 6.3.1.8 I/O Setup
- 6.3.1.9 Scaling Setup
- 6.3.1.10 Timing/Misc Setup
- 6.3.1.11 Alarms Setup
- 6.3.1.12 Output Setup
- 6.3.1.13 Comment Setup
- 6.3.2 Telemetry Communications Control Configuration
- 6.3.4 New Sensor Wizard
- 6.3.1 DS-4483 Sensor Configuration Settings
- 7LOADING PROGRAMS
- 8DEVICE CALIBRATION
- APPENDIX A
- APPENDIX B
- APPENDIX C
- APPENDIX D
32 iLink - Configuration and Support Utility
iQuest (NZ) Ltd - PO Box 15169 HAMILTON Tel: +64 7 957 8160 - Fax: +64 7 957 8162 - Email: iquest@iquest.co.nz
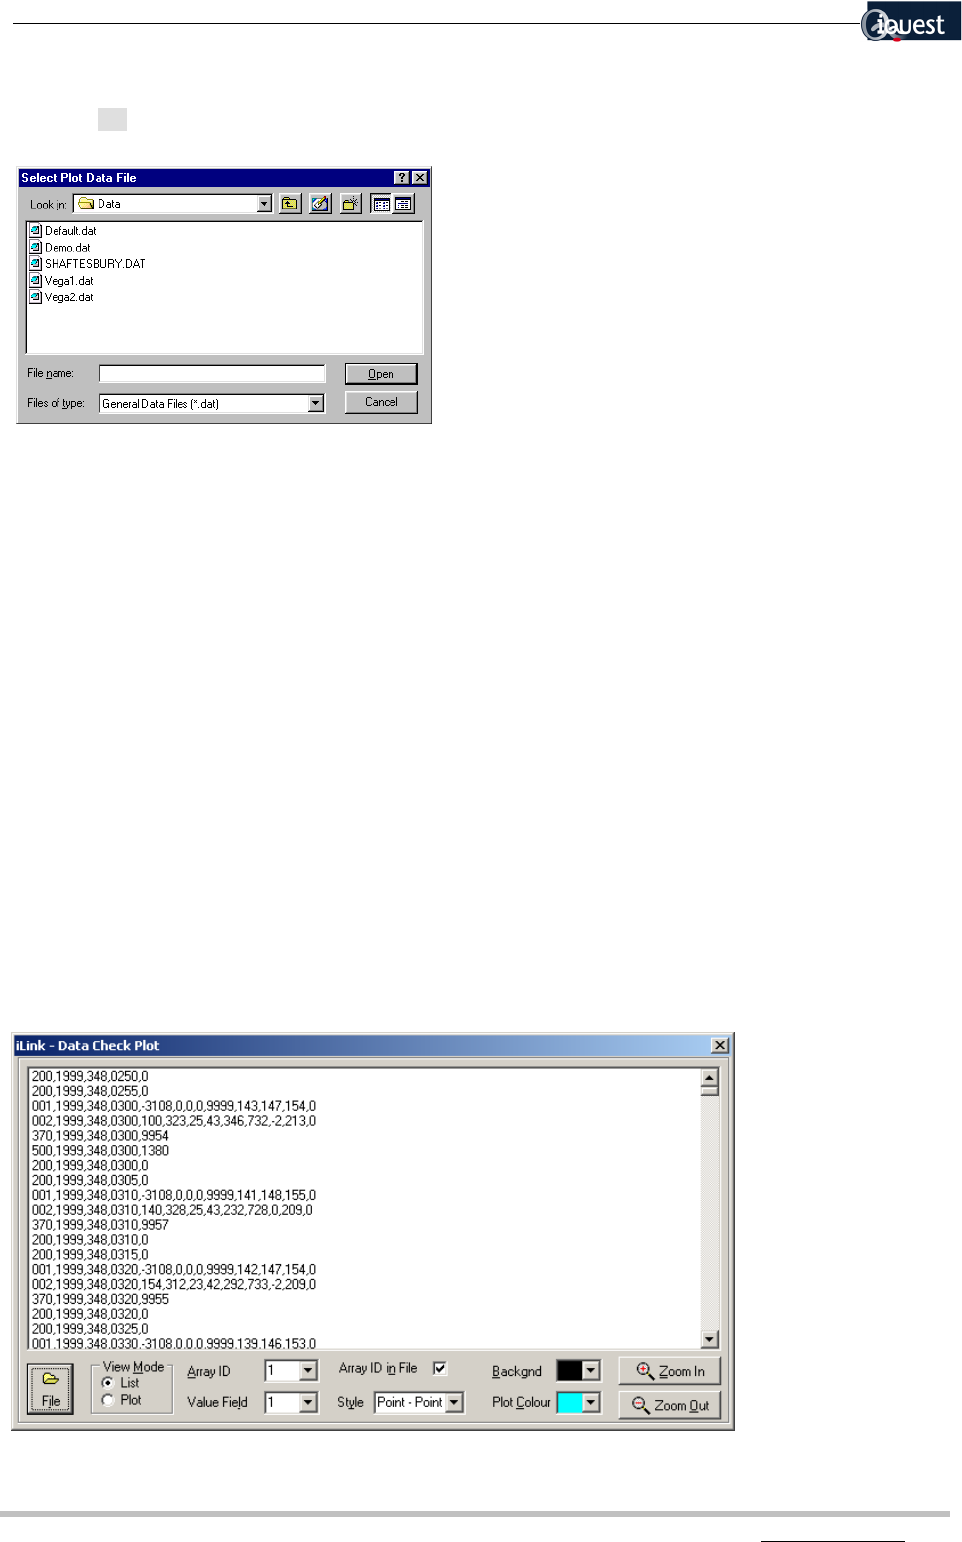
File Selection
Click on [File] to select the data file to open.
Click the button to select the logged data file that you wish to load into iLink and display in the window.
View Mode
Use this option to toggle between the plotted data and the raw, underlying samples.
Examples of each view are shown on the next page.
Array ID and Field
When in plot view, these settings are used to determine which logged samples are plotted. Enter the
required Array ID and the field number containing the samples you wish to view from the array. The first
sample for the specified array is in field number 1. The second is in field number 2 etc. For example, in
the listing shown below, for Array ID 002, field 1 contains the value 100, field 2 contains the value 323,
field 3 contains the value 25 etc.
5.2.1 Viewing Data in List Form
List view
The data is displayed in the data output format that was selected during the unload process described
previously. All the unloaded data is displayed in this listing. You can use the scroll bars to scroll through
the data or click on one of the data fields and use the arrow keys on the keyboard to scroll through the
data.