
Manual

Manual
GB Manual Expert Log 800-900.doc
30
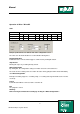
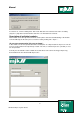
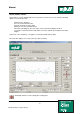
Display module (Viewer)
This module is used for displaying the measured values read out. The user can select the following
options to customize the view:
-
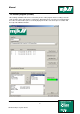
Channels to be displayed
-
Pressure and temperature units
-
Zoom in and zoom out of the graph
-
Display of cross-hair, grid and legend
-
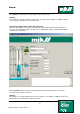
For better view ability, the pressure values can be inverted and displayed. This is
especially recommended for files with water level values (virtual representation of the water
height).
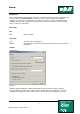
Under "File – Save as Bitmap..." the graph is saved in the default format (*.bmp).
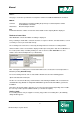
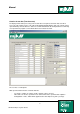
The status bar displays the x- and y-values per unit respectively.
Clicking this button resets the display to its starting state.