Model DH-21 Owner's Manual NOTICE This product embodies technology that is confidential and proprietary technology of DESIGN ANALYSIS ASSOCIATES, INC., and which is protected by United States copyright laws and international copyright treaty provisions, and/or by contract and applicable laws of trade secrecy. These include all Software, Printed Circuit Board Artwork, Schematic Diagrams, and Technologies applied therein.
Table of Contents User Agreement/WATERLOG® Warranty . . . . . . . . . . . . . . . . . . . . . . . . . . . . . . . . . . . . . . . W-1 Chapter 1 Introduction 1.1 Overview of the “WATERLOG” . . . . . . . . . . . . . . . . . . . . . . . . . . . . . . . . . . . . . . . . . . . . . 1.2 Unpacking the “WATERLOG” . . . . . . . . . . . . . . . . . . . . . . . . . . . . . . . . . . . . . . . . . . . . . . 1.3 Checking the Model Number . . . . . . . . . . . . . . . . . . . . . . . . . . . . . . . . . . . . . . . . . .
Chapter 4 Using the Graphical “WATERLOG” Software 4.1 Software Overview and Installation . . . . . . . . . . . . . . . . . . . . . . . . . . . . . . . . . . . . . . . . . . 4-1 4.2 Invoking WATERLOG.EXE . . . . . . . . . . . . . . . . . . . . . . . . . . . . . . . . . . . . . . . . . . . . . . . . 4-1 4.3 Overview of Options . . . . . . . . . . . . . . . . . . . . . . . . . . . . . . . . . . . . . . . . . . . . . . . . . . . . . . 4-2 4.4 Main Options . . . . . . . . . . . . . . . . . . . . . . . . . . . .
User Agreement/ WATERLOG® Warranty 1. NATURE OF THE PRODUCT This agreement accompanies a pressure measuring system comprising micro-coded circuitry and other electronic equipment sealed in an enclosed housing, and packaged together with written instructional materials. The packaged electronic circuitry and instructional materials herein are collectively referred to as the “PRODUCT.” The PRODUCT is made available from DESIGN ANALYSIS ASSOCIATES, INC.
4. TERM USER may enjoy these rights only as long as their possession of the PRODUCT shall continue to be rightful. These rights will cease if the PRODUCT is returned to DESIGN ANALYSIS under the terms of any redemption offer, warranty, or money-back guarantee, or if USER transfers the PRODUCT to another party on terms inconsistent with this agreement. 5.
(iii) EXCEPT FOR THE EXPRESS WARRANTIES ABOVE, DESIGN ANALYSIS SPECIFICALLY DISCLAIMS ALL OTHER WARRANTIES, INCLUDING, WITHOUT LIMITATION, ALL IMPLIED WARRANTIES OF MERCHANTABILITY AND FITNESS FOR A PARTICULAR PURPOSE. (iv) UNDER NO CIRCUMSTANCES WILL DESIGN ANALYSIS BE LIABLE FOR SPECIAL, INCIDENTAL, CONSEQUENTIAL, INDIRECT, OR ANY OTHER DAMAGES OR CLAIMS ARISING FROM THE USE OF THIS PRODUCT, THIS INCLUDES LOSS OF PROFITS OR ANY OTHER COMMERCIAL DAMAGES, EVEN IF ADVISED OF THE POSSIBILITY OF SUCH DAMAGES.
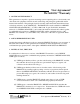
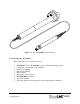
Chapter 1 Introduction 1.1 Overview of the “WATERLOG” The “WATERLOG” Sensor/Logger, as shown in Figure 1-1, is an innovative water level measurement system for use in ground and surface water measurement. Its design can eliminate the need for an instrument shelter or other site improvements. You will find the “WATERLOG” very reliable and easy to use. The small cylindrical design fits well casings as small as 2 inches in diameter.
Figure 1-1. The “WATERLOG” Sensor/Logger 1.2 Unpacking the “WATERLOG” Here are the items you should have received: 1. 2. 3. 4. 5. 6. 7. 8. WATERLOG® Series “WATERLOG” pressure transducer/data logger with polyethylene vented cable.
1.3 Checking the Model Number Before installing your new “WATERLOG”, check the information on the label of the sensor enclosure. Check the model number, the range, and the output type to be sure that you have received the instrument you ordered. The label will look similar to the following: Model: SN: Range: DH-21 12345 0-15 psi This example shows that the “WATERLOG” Model DH-21 measures pressure within the range from 0 to 15 psi.
Chapter 2 Installation 2.1 Installing the “WATERLOG” This chapter covers installation techniques for the “WATERLOG”. For proper installation, you will need the following: 1. 2. 3. 4. 5. 6. 7. 8. The Owner's Manual Your “WATERLOG” instrument A fresh 7.
2.1.2 Sample Well Installation The “WATERLOG” can be used inside a well casing. Figure 2-1 illustrates a typical ground well installation. The “WATERLOG” is suspended from the bail hook on the bottom end of the well head assembly using the stainless steel cable. One end of the stainless steel cable is attached to the support bail on the sensor and the other end is fastened to the ring on the bottom of the battery compartment. The ballast is attached to the ballast hook of the sensor, as shown in Figure 2-1.
2.1.3 Environmental Concerns Through years of experience dealing with measuring in the environment, we have learned that Mother Nature is very unforgiving to electronic equipment. There are several environmental concerns with respect to installation and use of the “WATERLOG”. 1. Although the “WATERLOG” is submersible, it cannot be frozen. Damage will occur to the sensor if it is frozen.
Figure 2-2. RS-232 Cable 2.3 Accessing the Battery Pack and Desiccant The “WATERLOG” uses a factory assembled 7.2-Volt, 13.5 Amp Hour “D” cell lithium battery pack. The battery can operate the “WATERLOG” for a period of up to 5 years, logging once per day. Logging on 15-minute intervals shortens battery life to 3 years. Likewise, more frequent intervals will shorten battery life even more.
Desiccant Cartridge can be reused by drying them in an oven at 160 F to 180 F for 24 hours or until the desiccant returns to a dark blue color. Figure 2-3 Accessing the Battery Pack and Desiccant Features of the Well Head Assembly: (1) Desiccant Cartridge (2) Circuit Board/Dry Air Assembly (3) Desiccant Packs (4) Battery Pack To inspect the Desiccant Cartridge (1), gently pull the Circuit Board/Dry Air Assembly (2) in the direction shown on the label, away from the lower portion of the well head assembly.
Chapter 3 Using the “WATERLOG” Software 3.1 Software Overview and Installation This chapter explains the menu options available for setting up and running the “WATERLOG” software from either the floppy or hard disk on a PC, Palmtop or laptop computer. The minimum system requirements for running this WATERGENTM software program is a 8088 processor with 640 K bytes of RAM. Note: This is not the WATERWARETM Graphical program. The “WATERLOG” software program WATERGEN.
The screen of the computer is updated every 5 seconds with the logger time, date and data. When the WATERGEN program is running, it issues a command to the “WATERLOG” telling it to provide the information displayed on the next screen update. When connected to the “WATERLOG” and running the WATERGENTM program, the “WATERLOG” will change to a continuous operating-power mode from the low-power mode to be able to respond to commands from the computer.
The Memory Used field indicates what percentage of the FLASH EEPROM currently has been filled. The FLASH EEPROM has 128 K bytes of storage. The FLASH EEPROM will not lose data in the event of a power failure and does not depend on a battery to maintain its data. This makes it ideal for remote, unattended data logging. The Logging Count indicates the number of samples stored by the “WATERLOG”. The maximum count is 10,922 counts with a 128 K byte FLASH EEPROM installed.
3.2 Configuration Options Menu 3.2.1 Reset Option For now we will skip the Run and Off options. Figure 3-2 shows a sample screen when the “WATERLOG” sensor is first installed. Notice the time and date values are meaningless and need to be initialized. The first option that should be invoked is the Reset (option 3). Press the number “3” key followed by . You will be notified that all data will be erased and the sensor will be reset. Enter a “y” on the keyboard to accept the Reset function.
3.2.2 Time/Date Option You can invoke menu item 4 as shown in Figure 3-3. The correct date and time must be typed in the format shown on the screen. This date and time are stored in the “WATERLOG”. The clock circuitry in the “WATERLOG” is powered from the main battery of the “WATERLOG”. You should always invoke the Reset and Time/Date options whenever the battery is changed. All data should be extracted from the “WATERLOG” before changing the battery or resetting.
3.2.3 Logging Mode Option Options 5, 6, and 7 configure the “WATERLOG” for unattended logging. Option 5 is shown in Figure 3-4. The logging rate indicates the elapsed time between measurements. The “WATERLOG” clock circuitry allows the “WATERLOG” to enter a low-power “SLEEP” mode of operation between measurements. Then when the selected measurement time interval has elapsed, which is specified in option 5, the “WATERLOG” will “WAKE-UP” and take a pressure, temperature and battery measurement.
There are five different sampling modes the “WATERLOG” sensor can operate under. Each Logging Mode is briefly explained below: Linear Mode: The Linear Mode is the simplest and allows the sensor to log data at a set time interval from once a second to once a day. Linear Mode is shown in Figure 3-5. Delta Mode: The Delta Mode, like the Linear Mode, allows for the selection of a fixed sample interval between 1 second to 24 hours.
3.2.3.1 Linear Logging Mode Option The Linear Logging Mode shown in Figure 3-5 is configured to have a constant time between each measurement. This allows you to change the value of the logging rate by using the up and down arrow cursor keys on the keyboard. When the correct logging rate is displayed, push the key and the “WATERLOG” will be programmed for the desired interval.
This option is handy for saving memory space since data is not logged if the data does not change more than the Delta Limit. You must decide how much change in level can happen before the sensor logs the data. Note that this check is on the level parameter only, not the temperature, and the value entered will be in the same units as set in the coefficients options. For example, if the coefficients units are set to feet, the Delta Limit will be in feet also.
Hyper Divisor: The Hyper Divisor is used to determine the faster scan rate. The faster scan rate is calculated by taking the regular scan rate and dividing it by the hyper divisor. The hyper divisor must be able to be divided into the regular scan rate without a remainder or it will default to 1.
The WaterLOG Status Date/Time Date Started Logging Rate Next Log Time Memory Used Logging Count Battery = = = = = = = = 1) Run 2) Off 3) Reset 4) Time/Date 5) Logging Mode 6) Coefficients Serial # T2000 RESET (DELTA) 02/28/95 03:52:15 01/01/95 14:39:00 00:01:00 00:00:00 0.0 % 0 Scans 6.8 Volts Version 1.1 Last Measurement PRESSURE TEMPERATURE 7) User Notes 8) Extract Data 9) View Data Enter Option: 5 Hyper Mode 1) Logging Rate = 00:01:00 2) Hyper Limit = 1.
is calculated by taking the regular scan rate and dividing it by the hyper divisor. The hyper divisor must be able to be divided into the regular scan rate without a remainder or it will default to 1.
The WaterLOG Status Date/Time Date Started Logging Rate Next Log Time Memory Used Logging Count Battery = = = = = = = = 1) Run 2) Off 3) Reset 4) Time/Date 5) Logging Mode 6) Coefficients Serial # T2000 RESET (HYPER) 02/28/95 03:53:04 01/01/95 14:39:00 00:01:00 00:00:00 0.0 % 0 Scans 6.8 Volts Version 1.1 Last Measurement PRESSURE TEMPERATURE 7) User Notes 8) Extract Data 9) View Data Enter Option: 5 Hyper-Delta Mode 1) Logging Rate = 00:01:00 2) Delta Limit = 1.000000 3) Hyper Limit = 1.
As mentioned, this mode is used to simulate a logarithmic logging mode. Below is a simple setup showing a logarithmic type logging setup. Time Between Samples Number of Samples Time Interval (Rate) (Samples) Logging Rate 1 00:00:02 59 0 - 2 min. Logging Rate 2 00:00:15 32 2 min. - 10 min. Logging Rate 3 00:02:00 25 10 min. - 1 hr. Logging Rate 4 00:15:00 28 1 hr. - 8 hrs. Logging Rate 5 02:00:00 32 8 hrs. - 72 hrs. Logging Rate 6 12:00:00 On going 72 hrs.
3.2.4 Coefficients Option The “WATERLOG” Sensor measures temperature and pressure/level. The units for these measurements can be scaled to other engineering units using option number 6 as shown in Figure 3-10. This option needs to be invoked for both temperature and pressure/level. You must first select temperature or pressure/level. The entry is a 1 for temperature and a 2 for pressure/level. Press the key after selecting the proper entry. This will cause an additional 4 options to be displayed.
The “WATERLOG” stores 160 characters of User Notes in the FLASH EEPROM. These notes allow you to enter information which will be recovered during data extraction. Figure 3-11 shows a sample User Notes screen. The cursor is placed in the “User Notes Edit/View” portion of the screen when option 7 is invoked. You can then overwrite or edit the existing notes. To store the entered User Notes, simply press the key. This means the key should not be pressed to go from line to line.
3.2.6 Run Option There are three basic modes of operation of the “WATERLOG”. Up to now the “WATERLOG” has been operating in the RESET mode. The other two modes of operation are RUN and OFF. In the RUN mode of operation, the “WATERLOG” will make a measurement at an interval set by the Logging Option specified in option 5. The data from the samples will be stored in the FLASH EEPROM in the “WATERLOG”. The “WATERLOG” will enter a low-power mode of operation to conserve battery power during the wait times.
The WaterLOG Status Date/Time Date Started Logging Rate Next Log Time Memory Used Logging Count Battery = = = = = = = = 1) Run 2) Off 3) Reset 4) Time/Date 5) Logging Mode 6) Coefficients Serial # T2000 RESET (VARIABLE) 02/28/95 03:57:35 01/01/95 14:39:00 00:00:05 00:00:00 0.0 % 0 Scans 6.8 Volts Version 1.1 Last Measurement PRESSURE TEMPERATURE 7) User Notes 8) Extract Data 9) View Data Enter Option: 1 = 0.0000 = 0.
The WaterLOG Status Date/Time Date Started Logging Rate Next Log Time Memory Used Logging Count Battery = = = = = = = = 1) Run 2) Off 3) Reset 4) Time/Date 5) Logging Mode 6) Coefficients Serial # T2000 RUN (VARIABLE) 02/28/95 04:07:17 02/28/95 04:00:00 00:01:00 04:07:55 0.1 % 15 Scans 6.8 Volts Version 1.1 Last Measurement PRESSURE TEMPERATURE 7) User Notes 8) Extract Data 9) View Data = -0.0052 = 78.
Shown in Figure 3-16, the software running in the computer will cause the “WATERLOG” to transfer the data to the computer, and place the data in a user specified file. The file name can be up to 8 characters in length. The computer software will append a “.DAT” extension on the filename. The data from the “WATERLOG” FLASH EEPROM will be placed in the specified file on the default disk drive.
The WaterLOG Status Date/Time Date Started Logging Rate Next Log Time Memory Used Logging Count Battery = = = = = = = = 1) Run 2) Off 3) Reset 4) Time/Date 5) Logging Mode 6) Coefficients Serial # T2000 OFF (VARIABLE) 02/28/95 04:08:46 02/28/95 04:00:00 00:01:00 04:07:55 0.1 % 15 Scans 6.8 Volts Version 1.1 Last Measurement PRESSURE TEMPERATURE = -0.0052 = 78.07 7) User Notes 8) Extract Data 9) View Data 10) 11) 12) 13) Enter Option: 8 Extract ALL Data Destination Filename: myfile1.
Warning: If the power has failed in the “WATERLOG”, the FLASH EEPROM will still contain the data sampled up to the time of the power failure. Power to the “WATERLOG” must be restored. Memory pointers will be initialized to the last location in the FLASH EEPROM. Therefore, extract data using menu option 8 before resetting the “WATERLOG”. 3.2.9 View Data Option You can examine the data stored in the FLASH EEPROM by selecting option number 9.
3.2.10 Measure Data Option The Measure Data Option causes the “WATERLOG” to take a measurement as shown in Figure 3-20. The “WATERLOG” makes the measurement and stores the results in the FLASHEEPROM. The software in the computer will then query the “WATERLOG” for the measurement, which is displayed in the top right window of the screen.
The WaterLOG Status Date/Time Date Started Logging Rate Next Log Time Memory Used Logging Count Battery = = = = = = = = 1) Run 2) Off 3) Reset 4) Time/Date 5) Logging Mode 6) Coefficients Serial # T2000 OFF (VARIABLE) 02/28/95 04:11:54 02/28/95 04:00:00 00:01:00 04:12:51 0.1 % 16 Scans 6.8 Volts Version 1.1 Last Measurement PRESSURE TEMPERATURE 7) User Notes 8) Extract Data 9) View Data Enter Option: 11 = -0.0051 = 78.
The WaterLOG Status Date/Time Date Started Logging Rate Next Log Time Memory Used Logging Count Battery = = = = = = = = 1) Run 2) Off 3) Reset 4) Time/Date 5) Logging Mode 6) Coefficients Serial # T2000 OFF (VARIABLE) 02/28/95 04:12:23 02/28/95 04:00:00 00:01:00 04:12:51 0.1 % 16 Scans 6.8 Volts Version 1.1 Last Measurement PRESSURE TEMPERATURE = -0.0051 = 78.
The WaterLOG Status Date/Time Date Started Logging Rate Next Log Time Memory Used Logging Count Battery = = = = = = = = 1) Run 2) Off 3) Reset 4) Time/Date 5) Logging Mode 6) Coefficients Serial # T2000 RESET (VARIABLE) 02/28/95 04:13:02 02/28/95 04:00:00 00:01:00 04:12:51 0.0 % 0 Scans 6.8 Volts Version 1.1 Last Measurement PRESSURE TEMPERATURE = -0.0051 = 78.
WaterLOG Self Diagnostics Starting FLASH test Load odd-length pattern into FLASH to verify address bus Verify odd-length pattern in FLASH Load zeros into FLASH Verify zeros in FLASH FLASH test: PASSED Starting user notes test Clear user notes in EEPROM Write default user notes in EEPROM Verify default users notes in EEPROM User notes test: PASSED Starting Measurement test Pressure = -.0052 RAW Pressure = +2.210898 Temperature = +78.6 RAW Temperature = +4.
Chapter 4 Using the Graphical "WATERLOG" Software 4.1 Software Overview and Installation This chapter explains the various menu screens you see when running the "WATERLOG” software from a hard disk on a PC or laptop computer. The minimum requirements to run the software program is a 80386 processor with 4 Megabytes of RAM and a VGA Monitor. A bus mouse or a serial mouse on a COM port 1 greatly assists in working with this software, and using a color VGA monitor will enhance the graphics.
The following will be displayed on the screen. Wrong number of parameters have been specified. WATERLOG ; < > = Optional DEFAULT : (STAND = 1, COM = 2) STAND: 1 = CONNECT 2 = STAND-ALONE 3 = STAND-ALONE ONLY COM : 1 = COM1 2 = COM2 Example 1: WATERLOG Uses defaults (CONNECT) (COM2) Example 2: WATERLOG 2 1 Uses user defined (STAND-ALONE) (COM1) Note: WATERLOG.EXE uses the standard IBM PC serial port interrupt configuration; IRQ4 for COM1 and IRQ3 for COM2.
Figure 4-1. Master Menu Screen Figure 4-1 shows the master menu screen. This screen is divided into seven sections. The function of each section is described as follows: Battery Window: The Battery window shows the status of the “WATERLOG” battery. This will be updated about every 5 seconds while the sensor is “Attached”. The bar graph gives a quick visual indication of the battery status and the number below the graph gives the actual voltage. If the battery voltage is below 5.
the actual percent full. As the memory fills, warning messages will be displayed at the bottom of the screen. When the memory is above 70% full, the message will show “Filling Up”, and at 90% the message will be “Dump Soon”. If the memory becomes full, the sensor will continue to log data but the oldest data will be overwritten and lost. This window may be moved and resized.
Line 5, Logging Rate: The logging rate is a time from 1 second to 24 hours in the form of 00:00:01 to 24:00:00. This is how often the sensor will log data. Line 6, Start Time: The start time shows when the sensor started to log data. If no sensor is attached, this line is not valid and NA will be displayed. Line 7, Start Date: The start date shows when the sensor started to log data. If no sensor is attached, this line is not valid and NA will be displayed.
Main Options Window: The main option buttons allow full control of the sensor when it is connected, and the ability to generate setup files in a stand-alone mode. The options can be selected by using the mouse and clicking on the desired button or by pressing the key placed in the brackets [ ]. Use of this software does not required a mouse. Using the keyboard you can perform all the functions of the mouse. [O]peration Mode: When attached to a sensor, this option is used to change the mode of operation.
will cause the sensor to record levels with a -5.0 foot offset. The logged value is based on the following equation: Logged Level = True Level - Offset All components of the equation must use the same units such as feet. This option also allows you to easily remove any error in the pressure measurement due to long-term offset drift. [S]ensor Info: This option is used to view specific sensor information not related to the operation of the unit. This includes serial numbers and model numbers.
Box in upper right corner: When there is a small box in the upper right corner, it is used to maximize the window or display the window using the whole screen. Clicking on the box will maximize it. If a window has been maximized, clicking on the box again will return it to its normal size. Box in upper left corner: When there is a small box in the upper left corner, it is used to close the window. Clicking on the box will close it.
Figure 4-2. Reset Option Figure 4-3 shows the same screen as Figure 4-2 except the Operation Mode box has been moved down to uncover the status section on the main screen. To move the Operation Mode box to a different location on the screen, put the mouse arrow on top of the words Operation Mode and hold down the left mouse button. While holding down the left mouse button, move the mouse to a different location on the screen. The Operation Mode box should follow the mouse to a new location on the screen.
Figure 4-3. Reset Option with Operation Mode Box Moved Warning : This option should not be invoked if there is data in the FLASH EEPROM which needs to be extracted. In the event of a dead battery, the memory pointers in the “WATERLOG” will point to the last location in memory. Therefore, you can extract data by clicking on the “Extract Data” button before resetting the “WATERLOG”.
4.4.1.2 Stop Logging Option The sensor can be paused and the logging operation halted by entering the OFF mode. The OFF mode allows the execution of the options not allowed in the RUN mode except for Time/Date and Diagnostics, which can only be executed in the RESET mode of operation. Figure 4-4 shows how the OFF mode is invoked. You must confirm this option by clicking on the OK button to prevent inadvertent operation. Figure 4-4. Stop Logging Option 4.4.1.
Figure 4-5. Run Option In the Run Option, a start time can be specified. This will allow you to manually select a start time in the next 24 hours. This may be used to start the logging process at midnight or some other desired time.
Figure 4-6. Run Option/ Start Time With the “WATERLOG” in the RUN mode, you can disconnect the interface cable to the sensor and it will continue to operate in the run mode until manually disabled or the battery power is lost. The batteries are designed to operate the unit for up to five years depending on the sample rate. There are several options which will not execute in the RUN mode of operation because they disrupt the logging process.
4.4.2 Time/Date Option Changing the time and date is shown in Figure 4-7. The correct date and time must be typed in the format shown below: Time (HOUR:MINUTE:SECOND) Date (MONTH:DAY:YEAR) range is (00:00:00 to 23:59:59) range is (01/01/00 to 12/31/99) This date and time are stored in the “WATERLOG”. The clock circuitry in the “WATERLOG” is powered from the main battery of the “WATERLOG”.
4.4.3 Logging Mode Option Logging Mode, Coefficients, and User Notes configure the “WATERLOG” for an unattended logging session. The Logging Mode Option is shown in Figure 4-8. The logging rate indicates the elapsed time between measurements. The “WATERLOG” clock circuitry allows the “WATERLOG” to enter a low-power “SLEEP” mode of operation between measurements.
the new “Next Log Time” has already occurred, the “WATERLOG” will continue to add the logging rate to the new Next Log Time until the new Next Log Time is in the future. Then the “WATERLOG” will “WAKE-UP” to take the next sample. There are five different modes the “WATERLOG” sensor can operate under. Each Logging Mode is briefly explained below: Linear Mode: The Linear Mode is the simplest and allows the sensor to log data at a set time interval from once a second to once a day.
Figure 4-9. Linear Mode Option 4.4.3.2 Delta Logging Mode Option The Delta Logging Mode shown in Figure 4-10 provides the means to log data only if it is changing more than a set limit. Logging Rate: This is just like in the Linear Mode. Delta Limit: The Delta Limit sets the point that determines if the scanned data is to be logged or not. Each time the sensor takes a reading, it will compute the absolute difference between this reading and the last logged reading.
This option is handy for saving memory space since data is not logged if the data does not change more than the delta limit. You must decide how much change in level can happen before the sensor logs the data. Note that this check is on the level parameter only, not the temperature, and the value entered will be in the same units as set in the coefficients options. For example, if the coefficient units are set to feet, the delta limit will be in feet also. Figure 4-10. Delta Mode Option 4.4.3.
Hyper Limit: The Hyper Limit will be expressed in the unit of measure specified under the conversion options with inches, feet, meters, PSI, etc., being common units for this field. As long as the difference between the current scanned level and the last logged level is less than this set hyper limit, the scan rate will stay at the regular rate. If the difference is greater than the set hyper limit, the scan rate will jump to a faster preset scan rate.
Figure 4-11. Hyper Mode Option Here is an example of the Hyper Logging Mode. The scan rate is set to 30 seconds, the hyper divisor is set to 15, and the hyper limit is set to 2.00 with the units assumed to be in feet. The logger is started and the first data point is logged. The next and all future logs will compute the difference between the current log and last log. If the difference is less than 2.00, the next log is scheduled to happen in 30 seconds. If the difference is greater than 2.
It is important to realize that the faster scan rate will not start until the sensor sees the change, so some of the changing data at the first may be lost. Determine what losses are acceptable, and what reporting times are needed to set up this mode of operation. Again, note that this check is on the level parameter only, not the temperature, and the value entered will be in the same units as set in the coefficients options.
SCAN RATE 1 minute 1 minute 1 minute 1 minute 1 minute 1 minute 1 minute 1 minute 1 minute 1 minute 1 minute 1 minute HYPER DIVISOR 60 30 20 15 12 10 6 5 4 3 2 1 FAST SCAN RATE 1 seconds 2 seconds 3 seconds 4 seconds 5 seconds 6 seconds 10 seconds 12 seconds 15 seconds 20 seconds 30 seconds 60 seconds This option allows the sensor to capture and record quick changing data without the expense of battery life by adjusting the scan rate based on the data change rate.
Figure 4-12. Hyper-Delta Mode Option 4.4.3.5 Variable Logging Mode Option The Variable Logging Mode shown in Figure 4-13 is used to set up special logging modes like a simulated logarithmic logging rate used in pump or slug tests on a well. There are six different time periods in this mode and each can be set for a different logging rate and length. Select Rate X: The top half of the screen has six boxes labeled “Select Rate 1” to “Select Rate 6”.
Number of Samples: The bottom half of the screen has 5 boxes labeled “Time 1” to “Time 5”. This represents the time periods 1 to 5. The number in each box is the number of scans that will be done during that time period. There are six time periods, but only options to set the number of scans for the first five. This is because the last time period will log data at the specified rate until you stop the logging process.
Figure 4-13. Variable Logging Mode Option 4.4.4 Coefficients Option The Coefficients options shown in Figure 4-14 are used to set the desired units of measure for the level and the temperature. If one of the predefined options is not usable, you can enter in your own equation as needed. Pressure / Level: The standard choices for pressure / level are inches, feet, centimeters, meters, and PSI. When one of these choices is used, the conversion factors are automatically setup as needed.
Temperature: The standard choices are Celsius and Fahrenheit. Again, if one of the standard choices is used, the conversion factors are setup automatically. If the standard choices are not usable, the “User Defined” option can be used to enter in a more appropriate conversion. Pressure Compensation: The options here are “User Defined” and “Default”.
4.4.4.1 Pressure Coefficients Option The User Defined Pressure Coefficients Option shown in Figure 4-15 allows you to modify the level or pressure coefficients and the units label. The equation for the temperature conversion has the following form. Units = (X) * (Slope) + (Offset) Units: The user preferred unit of measure. Examples are feet, meters, inches, PSI or whatever you prefer. X: This is the default value returned from the sensor in PSI.
Figure 4-15. User Defined Pressure Coefficients Option 4.4.4.2 Temperature Coefficients Option The User Defined Temperature Coefficient Option shown in Figure 4-16 allows you to modify the temperature coefficients and the units label. The equation for the temperature conversion has the following form. Units = (X) * (Slope) + (Offset) Units: The user preferred unit of measure. The normal units are Fahrenheit, Celsius, Kelvin, and Rankine.
Slope: This is the M factor of the standard Y = MX + B equation. It represents the rate of change for a given change of X. Offset: This is the B factor of the standard Y = MX + B equation. The offset can also have a value added to it to allow the results to be referenced to some other point like freezing or boiling point. When entering this option, the values will reflect the last valid setting used. For example, if Celsius was the last valid selection, the units would be “Deg C”, the slope would be “1.
Figure 4-16. User Defined Temperature Coefficients Option 4.4.4.3 Pressure Compensation Option The User Defined Pressure Compensation Options shown in Figure 4-17 are provided so you can guarantee the accuracy of the data for your application. Level readings will vary based on latitude, elevation, and density of the medium to be measured. Latitude: The first option is to enter in the latitude of the site. This must be in the range of 0 to 90 degrees. The default is 0 degrees.
Offset: The fourth option is to enter any desired offset. This may be used to add an offset to make the level reading reference some point like sea level, or for example, the top of a dam. If the User Defined Pressure Option is used, the additional offset will have to be added there. This option will not be available when PSI or user defined modes are selected under the pressure option. Figure 4-17. User Defined Pressure Compensation Option 4.4.
characters each. There is no wrapping feature between lines, therefore, each line needs to be edited independently. If the INSERT key is pressed, you can insert characters until the maximum length of 40 characters is reached. Figure 4-18. User Notes Option The User Notes can be used to store information while the sensor is logging. This is useful for entering site conditions, for example: “Jan 1, 95 Replaced Battery”. 4.4.
Figure 4-19. Extract Data Option Shown in Figure 4-20, the software running in the computer will cause the “WATERLOG” to transfer the data to the computer and place the data in a user specified file. Below are the options available to you for saving files. New Filename: You can type in a new file name leaving the extension as it was, or overwrite an existing file by highlighting the file in the second box down, the file list box.
DIR: The third box down is a status box showing the current path and directory. This box cannot be edited. Drive: The fourth box down is the current drive and this can be edited by changing the drive letter and using the ENTER key. Using the mouse to select the OK button will not work when changing the drive. Figure 4-20.
Figure 4-21 shows a sample screen which is displayed during the Extract All Data process. This process can take several minutes when the FLASH EEPROM is full of data. The format of this file is described in chapter 5 “Guide to Data Analysis”. You can see the percentage of completion as shown on the screen. Figure 4-21. Extract ALL Data Option The “Last XXX Scans” option shown in Figure 4-22 allows you to retrieve a portion of the data file starting with the most current data.
the “WATERLOG” software will adjust the number to the total number of scans and start the extract process. Figure 4-22. Extract Last XXX Scans Figure 4-23 shows a sample screen which is displayed during the Extract New Data process. This option extracts all data recorded since the last time data was extracted. You can see the percentage of completion as shown on the screen.
Figure 4-23. Extract NEW Data Option Warning: If the power has failed in the “WATERLOG”, the FLASH EEPROM will still contain the data sampled up to the time of the power failure. Power to the “WATERLOG” must be restored. Memory pointers will be initialized to the last location in the FLASH EEPROM. Therefore, extract data before resetting the “WATERLOG”. 4.4.7 View Data Option The “View Data” options shown in Figure 4-24 allow an easy way to view the data in either a tabular form or as a graph.
Selecting tabular will display the data in a tabular report format. You can scroll through the data. Selecting graphical will display the data in a graphical format allowing you to customize and print the graph. Source Options: The source of the data can be from the sensor or from a data file that was retrieved from the sensor at an earlier time.
Figure 4-24. View Data Option You can examine the data stored in the FLASH EEPROM or a data file, by selecting View Data Tabular. The display will show Scan Number, Date, Time, Pressure, Temperature, and Battery Voltage as shown in Figure 4-25. Up to 16 samples can be displayed on the screen. If more than 16 samples are stored in memory, the “Home”, “End”, “PgUp”, “PgDn”, “ ”, and “ ” keys can be used to move through the data. Clicking on the corresponding buttons will also accomplish the same thing.
Figure 4-25. View Data Tabular Display The View Scans Option From “WATERLOG” shown in Figure 4-26 is used to select what data is to be viewed. The top box shows the total number of scans in the sensor. This is a status box only. Beginning Scan Number to View: The first option in the bottom box is used to set the beginning point for viewing data. The default is 1, indicating start at the beginning of the data.
Figure 4-26. View Scans From WATERLOG Option When first entering this screen, there will be one graph labeled “Main” (shown in Figure 4-27) which shows all the data to be graphed. Pressing the button “Both Graphs” (shown in Figure 428) will spilt the screen to show a second graph labeled “Auxiliary”. When both graphs are displayed, the master graph will also have two cursors (white vertical lines). The auxiliary graph will show all the data between the cursors.
Figure 4-27.
Figure 4-28. View Data Display When in the “Both Graphs” mode of operation, the main graph will have a set of vertical lines used for cursors. The data between the cursors will be displayed on the auxiliary graph. The cursor on the left is the start cursor and the cursor on the right is the stop cursor. The cursors can be moved by using the Zoom In, Zoom Out, Pan Left, and Pan Right buttons. However, the cursors can also be moved directly with a mouse.
Status Boxes: The mouse can be positioned on a graph and the status box will show the information for that spot on the graph. The data shown in the status box will be the actual time and date the data at that point was taken, and the level and temperature at that point. The mouse must be on the graph to update the status information. If a graph is not displayed, the status box for that graph will indicate it is inactive. Zoom In: This button will only work if both graphs are displayed.
Maximize: Both graphs have a box in the upper right corner that when clicked on with the mouse, will use the whole screen to show the graph. To get the graph back to its normal size again, click on the square box in the upper right hand corner. The “Graph Options” shown in Figure 4-29 allow some customization of the auxiliary graph. The changes made by these options will be displayed on the screen and a printed graph. Titles: The Auxiliary graph title is the only title that can be changed.
Figure 4-29. Graph Options The auxiliary graph may be printed by turning on the “Print Auxiliary Graph” option. The auxiliary graph is the only graph that can be printed. Normally, you will make any desired adjustments in the graph and then print it. If you leave the auxiliary graph as it was first displayed, it will be the same as the main graph, with the exception of the graph title. This provides a way to print the main graph.
Paper Orientation: The two options here are portrait and landscape. Auto Form Feed: When this option is selected, the printer will issue a form feed after the graph has been printed. Some printers will not print the last page until it gets a form feed, so the data for the graph will be in the printers buffer but will not print until you force a form feed. This option will cause the printer to print the graph by automatically adding a form feed at the end of the graph data.
Figure 4-31. Printer Output Figure 4-31 shows a typical graph of the “WATERLOG” software program.
4.4.8 Measure Data Option The Measure Data Option will cause the “WATERLOG” to make a measurement as shown in Figure 4-32. The “WATERLOG” makes the measurement and stores it in the FLASH EEPROM. The software in the computer will then query the “WATERLOG” for the measurement which will be displayed in the bottom center window of the screen. Figure 4-32.
4.4.9 Zero Sensor Option The “WATERLOG” software allows you to force the sensor to use a specific point as its zero offset point. For example, placing the sensor in 5 feet of water and pressing Zero Sensor button will cause the sensor to record levels with a -5.0 foot offset. Figure 4-33 shows the option selected. Figure 4-33. Zero Sensor Option The Zero Sensor Option can also be used periodically to remove errors in pressure measurements due to long-term drift.
4.4.10 Sensor Information Option You can see information about your “WATERLOG” sensor as shown in Figure 4-34. The Vendor, Model Number, Firmware Version, Printed Circuit Board Serial Number, Serial Number, and Product Revision number are available for technical support purposes. Figure 4-34. Read Sensor Information Option 4.4.11 Diagnostics Option The Diagnostics option as shown in Figure 4-35 performs several tests on the hardware of the “WATERLOG” sensor.
Figure 4-35. Self-Test Option Figure 4-36 and Figure 4-37 show the results of the Diagnostics. The first line tests the CONFIG register to see if the processor's COP timer is enabled. The diagnostics software in the “WATERLOG” then checks the program EEPROM memory for a correct checksum. The software then tests the RAM Memory, FLASH EEPROM memory, EEPROM user notes, and performs a measurement that returns pressure, raw pressure voltage, temperature, and raw temperature voltage.
Figure 4-36.
Figure 4-37. Self-Test Diagnostic Display 4.4.12 File Option The File Options shown in Figure 4-38 provide the means to save the current settings to a disk file as a setup file, and to retrieve a setup file previously stored on disk. This makes creating, saving and retrieving setups very simple. Setup information can be edited with or without a sensor being connected to the PC.
The options that are saved are listed below. Logging modes. Conversion options User notes View graph options The setup files will automatically have a .WSF extension appended to them. The WSF stands for “WATERLOG” Setup File. When retrieving a setup file, all *.WSF files in the selected directory will be displayed. There is also a setup file saved every time the program is exited. This file is called WATERLOG.WSF and will be retrieved when the program is started again.
Figure 4-38. File Options 4.4.13 Attach Option The Attach option shown in Figure 4-39 allows the “WATERLOG” software to work in a stand-alone mode or while connected to the sensor. To use the attach option, the sensor must be physically connected to the serial port of the PC. The “WATERLOG” software is expecting a mouse (if used) to be on COM port 1, and the sensor to be connected to COM port 2.
In the stand-alone mode the “WATERLOG” software will not display all status information of the sensor and it will not perform functions requiring the sensor to be connected. These functions include setting the time and date, forcing the sensor to make a measurement, zeroing the sensor, extracting data, setting the operation mode and sensor diagnostics. The stand-alone mode is handy for setting up the majority of the options for the sensor while not connected or attached.
4.4.14 Help Option General Help shown in Figure 4-40 gives a basic understanding about the different functions of the “WATERLOG” software. Figure 4-40.
Chapter 5 Guide to Data Analysis Data is placed in a file on your DOS disk under the filename you specified with a “.DAT” extension when using option 8 from the main menu, using the Generic WaterGEN.EXE program, or using the Extract Option in the WaterLOG.EXE Program. Figure 5-1 shows the beginning segment of a file extracted from the “WATERLOG”.
“WaterLOG Logging Module (All data extracted)” “Serial Number : T2000" “Extracted : 08:11:18 03/02/95" “Logger Started: 16:20:00 03/01/95" “Logging Rate #1 : 00:00:05, Samples : 19" “Logging Rate #2 : 00:00:30, Samples : 20" “Logging Rate #3 : 00:01:00, Samples : 0" “Logging Rate #4 : 00:01:00, Samples : 0" “Logging Rate #5 : 00:01:00, Samples : 0" “Logging Rate #6 : 00:01:00 (final)” “User Notes” “ WaterLOG Down Hole Data Logger “ “ From “ “ Design Analysis Associates, Inc.
Chapter 6 Maintenance/Trouble Shooting 6.1 Maintenance The “WATERLOG” was designed to be a low maintenance instrument. The batteries should be monitored, and will need to be changed when the voltage gets below 5.5V. The “WATERLOG” was designed mainly to be used in an unattended mode to prolong battery life.
No Response 1) Verify power to the “WATERLOG”. 2) Make sure you have connected the RS-232 cable properly. 3) Make sure that you invoked WaterLOG.EXE with the COM port that you connected the RS-232 cable to. Intermittent Data 1) Verify your power supply or battery voltage. As the power supply approaches the lower threshold of the “WATERLOG” supply range, it may begin to miss readings intermittently.
Appendix A Specifications SENSOR SPECIFICATIONS Accuracy (Maximum percent of error in measurement) Pressure: For measurement intervals less than 8 seconds: better than ±0.05% of full scale output (FSO) over temperature range referenced to a straight line stretched from zero psi to maximum pressure. For measurement intervals 8 seconds or greater: ±0.03% of FSO. Temperature: Internal temperature ±1 C over temperature range.
Environmental Restrictions Operating Range: 0 to 40 C (nonfreezing) Compensated Range: 0 to 40 C Storage: -10 to 70 C Extended Range: Consult Factory Media Compatibility Liquids and gases compatible with PVC, Polyethylene, Stainless Steel and Ethylene Propylene. Pressure Port Stainless steel screen with 149 micron filter, field replaceable. LOGGER SPECIFICATIONS Communications Interface Stored data is extracted via an RS-232 or RS-485 connection at 9600 baud, 8-bit with no parity, 1 stop bit.
GENERAL SPECIFICATIONS Power Supply Primary Source: 2 Lithium cells at 3.6 V, 13.5 AH each (User Replaceable) Or Alternate External Sources Ranging from 6V - 15V Sleep Mode: 600 A (max) Active Mode: 75mA (max) @7.2V with computer connected Current Drain: Dry Air System A desiccant filled dry air filter prevents moisture from condensing in the “WATERLOG,” this provides automatic compensation for changes in atmospheric pressure without impairing the sensor's accuracy.
T BLANK