
User guide


6-28 Scanning
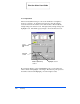
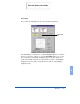
Master, Red, Green, Blue Channel
With color scanning selected, you may select a color channel via the color
buttons. This will allow you to adjust the highlight, shadow, and midtone
for each color in the Red ,Green , and Blue spectrum.
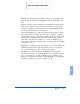
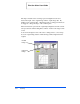
The histogram plot is a bar chart of pixel counts, or frequencies, plotted
against brightness levels with 0 (black) on the left end and 255 (white) at
the right end. The height of each line shows the number of pixels at a
particular brightness value.
To make changes to the histogram plot, and thus, to a preview image, drag
the triangular-shaped handles located below the horizontal bar.
Color Channel
Buttons
Print the 480cx User Guide