
User manual

User Manual
same manner as previously described.
• This can be repeated until the line is in the correct position.
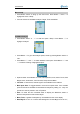
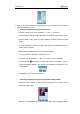
• Press Button “Menu” to confirm the location and the profile will be shown on the
image, displaying the minimum and maximum temperature of the line.
• Press Button “C” to exit the analysis of this line.
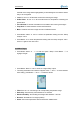
• Repeat the above procedure to analyze new lines
• Press Button “C” again to exit and return to the frozen/ saved image
Sub Menu Area
• Area analysis is merely available on frozen / saved images.
• Press Button “Menu” or “>” to enter the option “Analysis”. Press Button “ ” to ∨
highlight “Area”, select by pressing Button “Menu” or Button “OK”
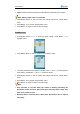
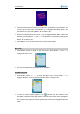
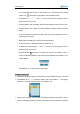
• Areas A, B, C, and D will appear. Four corresponding temperatures will be shown
respectively at the top of the screen as well as the temperature measurement type,
Minimum, Mean or Maximum
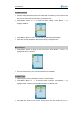
• Move the rectangular areas. Press Button “ ”∧ , “∨”, “<”and “>” to move area A
to the correct position. Press Button “Menu” to move on to area B and press
Button “ ”∧ , “∨”, “<”and “>” to move area B to the correct position. Repeat this
procedure until all areas are in the correct position
• Change sizes of the rectangular areas. Press Button “ ”∧ , “∨”, “<”and “>” to
move on to area A, press Button ● to enter the mode of adjusting area size.
Press Button “∧” and “>” to enlarge the area and Button “∨” and “<” to shrink it.
Press Button ● to confirm the new size. Press Button “Menu” to move on to area
B and repeat the procedure above until its size is suitable. Repeat this procedure
until all areas have appropriate sizes