
User manual


User Manual
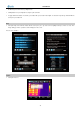
either by touch pen or by pressing the buttons.
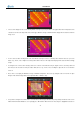
User can draw the required analysis area by the touch pen.
Discretional area can be set to display
the Maximum, Average or Minimum temperature. This is done by setting the value of Area Func in
option Analysis under submenu Setup and then choosing button OK to confirm the setup.
Press button C to exit and return to the live or frozen or save image.
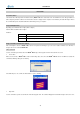
Save
Save can be performed on live or zoomed or frozen or saved images.
In live or zoomed images, bring up the main menu, press “Tools” and then select option “Save” under submenu “Analysis” either by the touch
pen or by pressing the buttons.
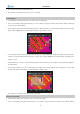
In frozen images, bring up the frozen toolbar with the touch pen or buttons. Click the icon “Save” with the touch pen to select it. Or press
“OK” to highlight the icon Save first and then press “Menu” to perform it.
“Save” can save the analysis objects on certain image.
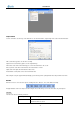
Delete
Delete can be performed on live or zoomed or frozen or saved images.
In live or zoomed images, bring up the main menu, press “Tools” and then select option “Delete” under submenu “Analysis” either by the
touch pen or by pressing the buttons.
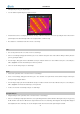
In frozen images, bring up the frozen toolbar with the touch pen or buttons. Click the icon “Delete” with the touch pen to select it. Or press
“OK” to highlight the icon Delete first and then press “M” to perform it.
“Delete” can cancel the selected analysis objects on certain image.
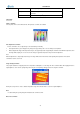
Histogram Analysis
Histogram Analysis can be performed on live or zoomed or frozen or saved images.
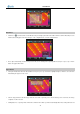
In live or zoomed images, bring up the main menu, select option Histogram under submenu Function either by the touch pen or by pressing
the Ok, and then set its value to be ON. Save the setup and back to the live or zoomed image, then histogram of the image will be displayed
at the right bottom corner of the image. To close the histogram, back to the menu and set the option Histogram to be Off.
43