
Instruction manual

. .
5 Analysis 76
After the number of repetitions specified or the specified end of the Auto Find routine is
reached, the Auto Find routine can be saved by clicking Save on the dialog window. The named
Auto Find routines are saved as .iwxfind files and can be called by clicking on the Load button
in the dialog window.
Specific
Events
The detection of Specific events within a recording requires the use of an algorithm to find the
point or region of interest (ROI). The LVEDP, the R in an ECG, and the P wave in an ECG are
good examples of Specific events. Detection of these data points requires a defined software
routine that resides in the DataTrax2 program. The routines are accessible by selecting Auto
Mark from the Tools menu and the name of the specific event from the Auto Mark drop-down
menu. When the detection routine is run on the selected data, the software puts Marks on the
data at the detected points. The automatic placement of Marks on the data accomplishes two
things; first, it identifies the data points that need to be manipulated; second, it provides the
user with visual cues to confirm that the software did the job of detecting the correct points.
Based on the instructions given to DataTrax2, the detected data can be exported as text or
loaded into a script.
In DataTrax2, there are Auto Mark functions available to detect: the components of the ECG,
the Blood Pressure and Peak Analysis.
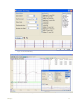
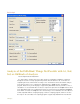
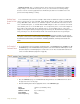
ECG For example, if the Auto Mark detector is used to locate the components in an ECG, the ECG
function is selected from the Auto Mark submenu on the Tools menu. A window known as the
AutoMark ECG Dialog appears on the screen. It contains a display of the data to be used with
the marking routine. In this window, selections must be made for the Data Channel that is the
source of the recording being marked, the Maximum Heart Rate (BPM) in the data of interest,
and the Start and Stop points for marking the data of interest.
The Start and Stop points could be the beginning and the end of the data file (Doc.), respec-
tively. They could also be any Mark on the data file. Since Marks can be placed on the data
after the recording, it is possible to place and use Marks that are on the margins of the data of
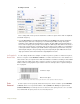
interest. To assist in R wave detection, a threshold level must be set on the data.
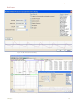
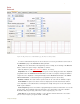
Finally, press Preview and close the AutoMark QRS Dialog window by clicking OK. Each R
wave in the selected section of data will be marked with a Text Mark. These marks can be
viewed and edited in the Marks window. The Marks window is organized so that the marks can
be sorted by Time (ascending or descending), Channel, or by Content by clicking on the title of
the column in the Marks table. Individual comments, or ranges of comments, may be selected or
deselected using the SHIFT and CONTROL keys. Appropriate collections of selected comments
can be exported or deleted.