
Instruction manual

. .
5 Analysis 74
Analyses of the Fourth Kind: Detected Data Conditions
DataTrax2 software can be used to identify Regions Of Interest (ROI) in recorded data. The
identified data points can be sent to either the Journal or the Marks window, where they can be
used to either build a report or be exported. While identifying data does not constitute an
analysis per se, the detection of specific data always precedes analysis. For example, to
measure changes in Left Ventricular End Diastolic Pressure (LVEDP) over time, the LVEDP
points need to be located in the field of blood pressure data and the corresponding values need
to be recorded. The statistical manipulation of the recorded LVEDP values is classified as
analysis; but, the first critical step in the “analysis” was the extraction of the relevant data points
or regions of interest from the complete data. The events (data points or regions of interest) that
can be detected by the DataTrax2 program are classified into two categories: General and
Specific.
General
Events
General events can be located easily through the Find or the Auto Find dialog windows.
Find Dialog
Window
The Find dialog window is accessed by selecting Find from the Tools menu. Data points of
interest can be identified using stock commands from the Find dialog window. These commands
can move cursors to: the Previous or Next Maximum; the Previous or Next Minimum; the
Previous or Next, Pos or Neg threshold crossing; Data Above or Below a certain amplitude;
data at a specific Mark with a particular string in a comment; data at an Old or New Cursor
position; and more. The calculations to be performed on the selected data points or on the data
between the points are chosen from the Table Functions list before the Find dialog window is
opened.
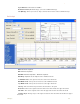
The first step in the Find function is the selection of the Cursor 1 Position from the box to the
right of this label. The next step in the Find function is the selection of the Cursor 2 Position
from the box to the right of this label. Once the source of the data is selected and the Find
routine is completed, it can be saved by clicking the Save button on the Find dialog window.
The named routine is saved in the Auto Find folder as an .iwxfind file. When the Find dialog
window is open, saved routines can be recalled by clicking on the Load button.
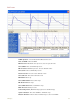
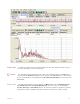
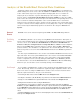
Find Example As an example, the Find function could be used to determine the time (T2-T1) between two
events. Occasionally, R waves in an ECG have significantly higher amplitudes than the other R
waves in the same recording. The Find function could be used to measure the time between
adjacent supranormal R waves. The process would include:
• Transferring the data of interest from the Main window to the Analysis window.
• Selecting the calculations ( V1, V2, V2-V1) to be performed on the data from the Table Functions list.
• Placing one of the 2 Cursors on a supranormal R wave on the left side of the Analysis window.
• Pulling down the Tools menu and selecting the Find function.
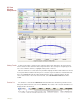
• Programming the cursor positions. To find the next supranormal R wave in the data, the Cursor 1
Position is set equal to Old Cursor 1 (which is already on a supranormal R wave). The Cursor 2 Position
is set to Data Above and the data channel is selected. The threshold amplitude, above which the Find
function will stop, is entered into the box below the label Cursor 2 Position. Then the Find routine is
saved.
• Clicking the Find button to place the cursors and to display the values for the selected Table Functions
at the top of the Analysis window.