
Instruction manual

5 Analysis 71
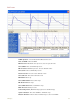
the maximum frequency that could be recorded reliably would be 500Hz. If a recording was made at 100
samples per second, the maximum frequency that could be recorded reliably would be 50Hz. When a
FFT is performed on data recorded with DataTrax2, the program sets the X-axis to a scale from 0Hz
(DC) to a frequency that is a half of the sampling rate. A region of the scale can be expanded by using
the cursors and the functions of the Channel menu, but frequencies greater than half the sampling rate
cannot be viewed.
2 To make an FFT work, the transform must operate on a specific number of data points. The number of
data points used in the FFT is algorithm dependent. By default The Snap to Grid option is selected,
which sets the second cursor to the location of the best selection of FFT data on the linear display
section of the FFT window. If you have to select a different selection, DataTrax2 will fill in the remaining
data points with zeros so the frequency content of the data that you did select will not be affected.
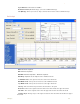
As stated in the first rule that governs FFT functions, DataTrax2 sets the X-axis limits in the
FFT window according to sample rate. Likewise, the number of data points used in the FFT
calculation sets the resolution of the X-axis range. If more data points are used, the available
Frequency Resolution will be greater. Frequency Resolution is set from the drop-down menu
in the left hand margin of the FFT window. Resolution choices are limited to 100 Hz, 10 Hz, 1 Hz
and 0.1 Hz. If the FFT cannot be displayed with the required frequency resolution, more data
points need to be used to make the calculation.
Moving and
Manipulating
Data in the FFT
Window
As with other analysis functions handled by the DataTrax2 program, it is necessary to select
the data to be operated upon by the program. The Display Time controls are used to get the
data of interest onto a single screen in the Main window. The selected data is moved to the FFT
window by clicking the FFT icon on the DataTrax2 toolbar or by selecting FFT from the
Windows menu.
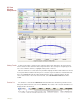
Once the primary data set is moved to the FFT window, the Dual Cursors on the linear graph
of the raw data (above the actual FFT display area) can be used to fine-tune the data selection.
Only the data between the cursors in the linear graph is actually used in the calculation. The
data displayed on the linear graph and available for the transform can be changed using the
Display Time icons on the FFT window or the scroll bar under the linear graph. As mentioned, if
Snap To Grid is selected, the DataTrax2 program selects the end point for the data selection.
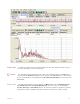
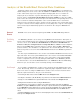
The FFT plot of the selected data is displayed in the area below the linear graph of the raw
data. The FFT display area has its own Display controls with the Zoom In, AutoScale and
Zoom Out functions and set of 2 Cursors. These features can be used to expand or contract
the area of the FFT graph between the cursors. This set of 2 Cursors also reports the values for
the selected Table Functions listed above the FFT window. The values and the titles, which are
listed in the Calculated Value Display area at the top of the window, can be copied to the
Journal by using the functions in the channel menu for the FFT display area.
FFT Window
Components