
Instruction manual

. .
5 Analysis 70
Channel Menu in
the XY Window
Clicking on the Channel Menu button or right-clicking in the display
area brings up the Channel menu.
Add Ch. Data to Journal: Adds data from the selected channel to
the Journal.
Add Title to Journal: Adds the function titles to the Journal.
Invert: Inverts the channel data.
Copy Graph: Copies the channel graph to the clipboard. This can be
then pasted into the Journal or any other program.
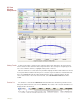
Marker Channel The marker channel is used to mark specific points of interest in the XY-Plot. The marker
channel is independent of the X and the Y channels, and should be setup in the Main window
such that the peaks in the marker channel correspond to the points of interest.
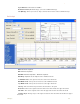
When a marker channel is used, data from the XY plot is extracted at the specified points of
interest and displayed in the Marker Data window. This data can be copied or exported by
clicking on Options.
Copy, Export,
and Print XY
View Window
To copy the view of the data displayed in the XY window, use the Copy command in the Edit
menu. The image can be pasted into any program (including the Journal) that supports the
clipboard.
To export the data viewed, use the Export command in the File menu. Select the format of the
file from the list at the bottom of the Export File window.
To print the data viewed, use the Print command in the File menu. The print range, which is
either the selection in the XY window or all the data, can be selected in the Print window
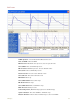
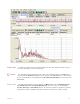
FFT FFT is short for Fast Fourier Transform, a mathematical operation that displays recorded data
as the relative amplitudes of the frequency components that make up the recorded signal. FFT
plots have Frequency on the X-axis and the Power (amplitude) contained in each frequency on
the Y-axis. FFT is used to determine the relative strengths of frequency components in a raw
signal. For example, in the EEG studies, the Alpha band is frequently mentioned. Alpha waves
are EEG signals with frequencies between 8 and 13 Hz. If a FFT is performed on an EEG
recording that has a high number of Alpha waves, the FFT will show a spike or a higher
amplitude (Power) at the frequencies in the Alpha band.
The DataTrax2 software can perform Fast Fourier Transforms on selected pieces of recorded
data in the FFT window. The FFT window is called either from the Windows menu or by clicking
the FFT icon on the toolbar at the top of the Main window. The selected data is moved to the
Linear Display area in the FFT window where adjustments can be made which optimize the size
of the FFT plot.
To ensure problem-free operation of the FFT function, there are a couple of rules to keep in
mind:
1 1. The mathematical underpinnings of digital sampling, which makes the DataTrax2 software work,
begin with a criteria known as the Nyquist Sampling Theorem. Harry Nyquist showed that the sampling
rate must be at least twice the highest frequency in the sample to reconstruct the original signal and
capture its fundamental frequency. The converse of this rule is that the fastest frequency that can be
reliably recorded is a half of the sampling rate. If a recording was made at 1000 samples per second,