
Instruction manual

. .
5 Analysis 68
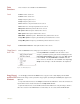
XY View
Window
Components
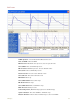
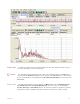
Selecting Channels To plot an XY graph, select the X-axis channel from the drop-down box in the top most plot.
Then select the Y-axis channel from the drop-down box in the second plot. If required you can
also select a marker channel, to highlight certain points of interest.
Once the channels are selected, the XY plot will be displayed. All the data visible in the X and
Y axis plots will be included in the XY plot. To select the region of data to be included in the XY-
Plot, select 2 Cursors from the toolbar and bracket the region of interest between the two
cursors in the X-axis or the Y-axis channel. Next, select Zoom Between Cursors from the
toolbar.
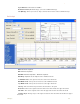
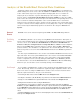
Functions List The functions selected in the Add Function list determine the calculations performed on the
data points between the two cursors in the XY-PLot. The results of the selected calculations are
displayed above the XY PLot.