
Instruction manual

5 Analysis 67
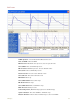
Trailing Slope: Average slope of the signal as it travels from the upper threshold to the lower
threshold
Max Slope: Maximum slope
Min Slope: Minimum slope
T @Max Slope: Time at maximum slope
T @Min Slope: Time at minimum slope
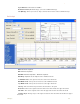
Copy, Export,
and Print
Analysis
Window
To copy the view of data displayed in the Analysis window, use the Copy command in the
Edit menu. The image can be pasted into any program (including the Journal) that supports the
clipboard. To copy a Channel, click the Channel menu and choose the Copy Graph menu.
To export the data viewed, use the Export command in the File menu. Select the format of the
file from the list at the bottom of the Export File window.
To print the data viewed, use the Print command in the File menu.
Analyses of the Third Kind: Redisplayed Data
As covered in the display section of this manual, data is recorded only into the Main window.
Main window displays are linear or in series, meaning that Y-value parameters are recorded with
respect to time.
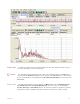
Data recorded in a linear manner can be redisplayed in a format that is different than the
standard Y-T plot. Currently, DataTrax2 supports XY plots and FFT. A host of measurements,
like the ones available in the Second Kind Analyses, can be made from each type of redis-
played data window.
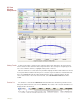
XY Plot In an XY plot, the Y-values from one channel in the Main window are plotted against the Y-
values from another Main window channel. The resulting XY plot is dramatically different from a
linear plot of data against time.