
Instruction manual

. .
5 Analysis 60
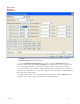
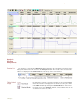
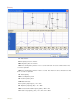
Figure 5-7: The DataTrax2 Analysis window.
Analysis
Window
Components
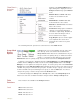
Functions List The functions selected in the Add Functions list determine the calculations performed on the
data points between the two cursors in the Analysis window. The results of the selected calcu-
lations are displayed in the Channel bar area at the top of the each Channel .
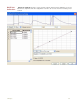
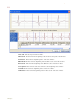
Tiled or Stacked
Display
By default, the channels selected for display are presented in Tiled
mode. Each channel is displayed in its own area, as they are shown
in the Main window. By clicking the Stacked/Tiled icon in the lower
left hand corner of the Analysis window, selected waveforms can be
overlaid on the same set of axes.