
Instruction manual
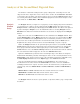

5 Analysis 59
Analyses of the Second Kind: Digested Data
The functions in this kind of analysis take a group of data points selected by the user and
"digests" them into a single value. These values can be saved to the Journal within DataTrax2
or exported to other programs. This kind of analysis can proceed in the Analysis window. There
are currently 24 functions available in the DataTrax2 program to do this kind of analysis. Some
of the functions are: Mean, Max, or Max-Min.
Analysis
Window
Setup
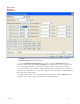
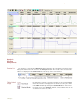
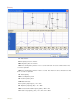
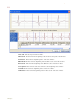
The Analysis window (see Figure 5-7 on page 60) is used to display and perform calculations
on selected pieces of data or sweeps captured from the Main window. The data used in the
Analysis window is defined by the data displayed in the Main window. The data is then captured
by either clicking the Analysis icon on the DataTrax2 toolbar or selecting Analysis from the
Windows menu. Data from all channels within the selected area are displayed in the Analysis
window.
Many of the same tools in the Main window are also available in the Analysis window. These
include: Display Time controls; Marks, which are the same as the ones positioned in the Main
window; and 2 Cursor mode (Single Cursor mode is unavailable). Scroll bars can be used to
fine tune the area of data upon which the selected functions will operate in Chart mode. In
Scope mode the sweeps of interest can be selected Individually or as part of a group.
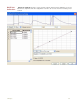
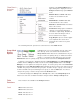
Data in the Analysis window can be operated upon by the functions selected with the Add
Function button just above the left hand side of the first channel. Functions are organized in
three groups: General, Derivative and Integral (Area). To add a function click on the Add
Function button, choose the Function Group and then the desired function from the submenu.
The selected function will now appear to the left of the Add Function button.
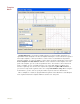
Again, the 2 Cursors are positioned on the left and right edges of the data to be analyzed.
DataTrax2 will immediately calculate and display the values for the selected parameters in the
Channel Bar of each channel. The precision of the calculations performed is adjustable using
the Data Display Precision value in the Options page of the Preferences window.
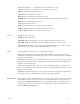
There are 24 analytical functions available in the Functions list. These functions are
described below. The values listed in the Channel Bar area can be sent to the Journal for
formatting and inclusion in reports. To do this, click on the Channel menu (or right-click in the
channel area) and select Add Ch. Data to Journal, Add Title to Journal or Add All Data to
Journal.
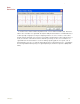
Add Ch. Data to Journal: Adds data from the selected channel to the Journal.
Add All Data to Journal: Adds data from all channels to the Journal.
Add Title to Journal: Adds the function titles to the Journal.
The Analysis window can also be copied, printed, or exported to ASCII, .png, or .bmp format
documents.