
Instruction manual

5 Analysis 45
Note: Deleting the raw data channel will cause the function channel to have invalid data.
Periodic Periodic functions operate on cyclic data to produce a graphical representation of how the
Rate, Frequency, Period, Cycle Maximum, Cycle Minimum, Cycle Mean, or RMS (Root Mean
Square) vary with time. The program calculates these parameters with each cycle of the signal
and displays the calculation on the screen.
Threshold To make these types of calculations on each cycle, the software must have a way of defining a
cycle of data. As data is collected on-line or processed off-line, the DataTrax2 program begins
the calculation by using the AutoScale feature to determine the Max and Min values in a given
screen of data. Then, the program uses a Threshold value to find points on the recording where
the trace repeatedly crosses the threshold with a positive slope. The control for the Threshold
level is set in the Periodic setup dialog, which appears when a periodic function is selected.
The Threshold level can be set at X% of maximum value in any given screen of data or an
absolute value. By default, X% is set to 60%, which is adequate for almost all biological signals.
The Threshold value can be changed by entering a different number in its box. Finally, the
program defines the time between the points, where the recording repeatedly crosses the
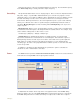
threshold line with a positive slope, as a Period (Figure 5-1 on page 45).
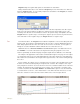
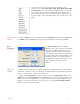
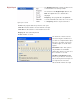
Figure 5-1: The Periodic setup dialog window.
Tolerance A second Periodic control known as Tolerance, or hysteresis, is present in the Periodic
setup dialog window. Tolerance is used to reduce false triggering due to noise in the signal. By
default the tolerance is set at 3%, if the threshold is set at 60% then the signal has to cross from
below 58.5% (60 - 3/2) to above 61.5% (60 + 3/2) for a threshold crossing to be detected. The
maximum value between two threshold crossings is taken to be the peak, and adjacent peaks
are used to calculate the periodic functions.