
Instruction manual

3 Display 33
3 Wait one minute, type “Test 2" and strike the Return or Enter key.
4 Click Stop. Scroll through the data using the scroll bar on the bottom of the Main window until you
locate “Test 1” in the Text Display area.
5 Click on the down arrow next to the Mark button and choose “Test 2". Notice that the record in the Main
window has moved to the “Test 2" mark.
6 Using the mouse, click and hold on the comment “Test 2" at the bottom of the screen. Continue holding
the mouse button down, and drag the mark comment to a new position on one of the available
channels.
7 Release the mouse button and the mark is locked on the selected channel. Comments positioned in this
way will remain where they are placed and will print exactly as you see them.
8 Try this exercise again with a mark created off-line. To create an off-line mark, open the Single Cursor
mode by clicking the Single Cursor icon in the DataTrax2 toolbar. Position the cursor where the off-
line mark is to be positioned. Type some text on the comment line at the top of the screen, and press the
Return or Enter key. The mark appears at the cursor location and the comment appears at the bottom
of the screen.
Sorting and
Exporting Marks
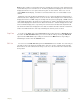
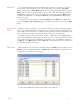
The Marks window displays the Time that a mark was made, the text comment attached to the
Mark, the Channel on which the mark was made and the Value of the amplitude at the mark.
Marks can be sorted by Time, Channel or the text comment of the Mark by clicking on the
column titles. Click once to organize marks in ascending order and a second time to change to
descending order.
Using the standard Windows
commands, SHIFT-CLICK and CONTROL-CLICK, specific marks
can be highlighted. Once selected, use the Export button to send selected marks to a text file
which can be opened in Excel or another spreadsheet program.
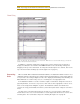
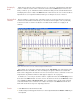
Voltmeter Large digital readouts of the amplitudes recorded on each channel can be displayed on the
right side in the Main window. Select the Voltmeter function from the View menu to display
these readouts. While data is being recorded, the most recent value is displayed. Also it
displays the amplitude of the trace on each channel at the position of a Single Cursor, or can
display the difference in amplitudes between the positions of 2 Cursors on each channel. As
discussed in the section on Views, the voltmeter display can be independently organized for
each view. You can set the fonts for the title and the value display as well the number of
columns displayed from the Options menu in the Voltmeter panel.
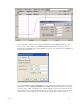
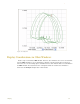
Online XY In OnlineXY mode, the Y-values from one channel in the Main window are plotted in real time
against the Y-values from another Main window channel. The resulting XY plot is dramatically
different from a linear plot of data against time. Select the OnlineXY function from the View
menu to display this plot. Select the Y and the X channel from the drop-down box, at the bottom
of the plot window. The Main window display time also applies to the OnlineXY plot.