
Instruction manual

. .
3 Display 26
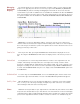
Rate function could be used on Channels 9-16 to calculate the heart rate of each animal from its
recorded blood pressure on Channels 1-8. As with any multi-channel display, the more channels
displayed means there is less space that can be given to each channel. In the case of a 16-
channel Main window display, it is hard to resolve detail in the trace of recorded data in each
channel.
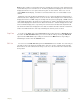
DataTrax2 solves this problem by allowing the user to create many different arrangements of
channels that can be displayed on the screen at one time. Each arrangement of channels that is
displayed is known as a View. Using the example from the previous paragraph, a View could be
created that displayed the arterial pressure from Channel 1 and the calculated heart rate for the
same animal displayed on Channel 9. The data from Channels 1 and 9 would appear in the first
and second data display areas, respectively. The other fourteen raw data and computed heart
rate channels would not be displayed. For the data recorded from another animal on Channel 2,
another view with Channels 2 and 10 (its matching rate channel) can be created.
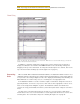
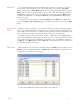
Using Views To create a new View, click on the View Control in the Toolbar and choose New View. Name
the view in the Edit View Name dialog. You can now edit the view by choosing the Edit View
option from the View Control, by resizing the channels in the Main window, or by hiding or
minimizing the channel from the Channel menu.
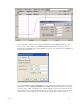
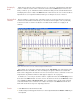
Edit View You can access the Edit View dialog from the View Control on the Toolbar. For each view you
can add or remove the Channels available in the View. You can also organize them vertically.
Each view has its own Voltmeter Panel and you can choose the channels in the voltmeter and
their position.