
Instruction manual

3 Display 25
Managing
Amplitude
Display
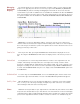
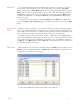
The vertical display of your signal is managed in a number of ways. In each channel toolbar
(Figure 3-7 on page 25), there are three icons. They represent the Zoom-In (x2), AutoScale
and Zoom-Out (x2) features. Clicking and dragging the waveform can be used to offset the
recorded wave up or down. In addition there is a Scale menu available from either the Channel
menu or by clicking on the values in the Y-Axis on the left hand side of each channel. There are
five options available from the Scale menu: Set Scale, Preferred Scale, Zoom In, AutoScale
and Zoom Out.
Figure 3-7: The channel toolbar in the DataTrax2 Main window.
AutoScale AutoScale, as used in the DataTrax2 software, reviews the current screen of data on the
channel of interest and locates the highest and lowest data points in that screen. It then adjusts
the Y-scale range to include those points. This optimizes the look of the waveform on the screen
giving you the best possible curve.
Zoom-In/Out From any view of data, pressing the Zoom-In button will double the displayed size of the
trace. Pressing the Zoom-Out button will reduce the displayed size of the trace by a factor of
two.
Preferred Scale For any data, there is a basic range within which the Y values of the signal will occur. For
example, if measuring room temperature, the user might select a range of 50
o
F to 100
o
F
because it is doubtful that the signal will move beyond these limits. If an event of interest occurs
during the recording, the area of interest can be expanded using the Zoom or AutoScale tools.
To return to the Preferred Scale set by the user, simply select the Preferred Scale option from
the Scale Menu.
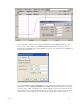
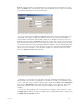
Set Preferred Scale To set the range of the Preferred Scale, choose the Set Scale option from the Scale menu
and enter the upper and lower limits of Y-scale in the Set Scale dialog window that appears.
Scroll Up/Down When the Zoom tools are used, the data may drift above or below the center of the display
area, or even go out of the range of display. To adjust the position of the trace on a channel,
click and drag the waveform to the desired position.
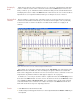
Views DataTrax2 can acquire data on up to eight channels on the WPI 118 (four channels on the WPI
214), but it can calculate data on up to 128 channels. The extra channels can be used to display
computed functions that are mathematically derived from the raw data. For example, the arterial
pressure from eight different animals could be recorded on channels 1-8. Simultaneously, the