
Instruction manual


. .
3 Display 24
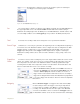
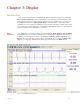
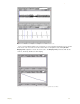
Figure 3-5: ECG viewed with a long screen time (top) and a short screen time (bottom).
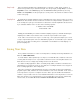
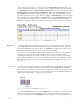
In the second example (Figure 3-6 on page 24), a one hour battery discharge curve is shown
in two views. The 2-second screen time shows almost a straight line, but clicking Double
Display Time eight times reveals the entire curve. The Display Time parameter, with its two
controls, effectively handles the time display.
Figure 3-6: Voltage drop of 9-Volt battery viewed with short (top) and long (bottom) screen times.