
Instruction manual


. .
3 Display 22
for the position of the cursor is reported in the Clock Area in the upper right hand corner of the
Main window. Single Cursor mode is used to determine values and to place marks in the record
after recording has stopped.
To access 2 Cursor mode, press the 2 Cursor icon (Figure 3-3 on page 21) in the toolbar. In
this mode, the Value Display area reports the difference in value between Cursor 1 and Cursor
2. In a similar way, the Clock Area reports the difference in time between the two cursors. When
using 2 Cursor mode, the cursor farthest to the left is always Cursor 1 and the other to the right
is always Cursor 2. 2 Cursor mode is also used to define the right and left boundaries of a
selection of data. This selected area can be used to determine what two values are used to
accomplish the Units Conversion function.
Moving Cursors Once cursors have been called, they may be moved by placing the mouse over the cursor bar,
clicking, holding and dragging them to the right or left. Cursors may also be moved using the
arrow keys on the keyboard. In 2 Cursor mode, you can change the cursor that is moved by
using the UP arrow. Pressing the RIGHT or LEFT arrow key on the keyboard, moves the cursor
one data point. Holding the SHIFT key down while using the arrow key causes the cursor to
move five data points at a time; and holding the CONTROL key down while pressing the RIGHT
or LEFT arrow moves the cursor forward 10 points at a time.
Behavior of
Cursors
In Single Cursor mode, the value displayed represents the value identified on the channel by
the one and only cursor. If the data is scrolled so that the cursor goes off screen, the cursor is
automatically garaged and the channel display area will display the value of the visible data
point furthest to the right.
In 2 Cursor mode, Cursor 1 is always the left hand cursor. If Cursor 2 is moved to the left of
Cursor 1, it becomes Cursor 1. Values reported in the Value Display area are always the
difference between Cursor 2 and Cursor 1 (Cursor 2 minus Cursor 1). If the data is scrolled, so
that one of the cursors is no longer on the screen, that cursor is automatically garaged and the
display goes to Single Cursor mode.
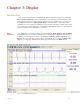
Exercise Load the data file Cursor_Exercise.iwxdata in the Program Files->WPI->DataTrax22->tutorial
files folder, by selecting the Open item in the File menu. The data displayed on Channel 1 is a
±2V sine wave. Note that the Value in the Value Display area corresponds to the voltage of the
last data point (farthest to the right) in the window.
• Select Single Cursor mode by pressing the Single Cursor icon in the toolbar (Figure 3-3 on page 21).
• Record the value that corresponds to the position of the cursor.
• Click, hold and drag the cursor over the highest point in a given cycle of the data. Adjust the position of
the cursor bar left or right by using the left or right arrow keys on the keyboard. Adjust the position of the
cursor bar so that the Value in the Value Display area reads +2V.
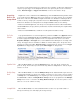
• Call the 2 Cursor mode by pressing the 2 Cursor icon in the toolbar (Figure 3-3 on page 21).
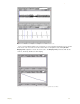
• Position Cursor 1 so that it is over the maximum value in a given cycle, then position Cursor 2 over the
minimum value as shown (Figure 3-4 on page 23). The Value reported will be 4V.
• Now, drag Cursor 2 to the minimum value before Cursor 1. When you release Cursor 2, it becomes
Cursor 1 and the new Value reported is -4V.