
Instruction manual


3 Display 21
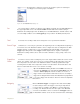
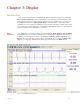
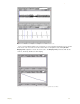
Each channel has its own set of controls located in a Channel Bar immediately above each
channel’s data window (Figure 3-2 on page 21). Y-axis scaling is printed to the left of the data.
The Channel Bar contains the Channel Menu, Channel Title, buttons for Y-axis display control
(Zoom-In, AutoScale and Zoom-Out), Add Function button and a Value Display area. The
Value Display box located to the extreme right on the channel bar will display different values
depending on the state of the program. While recording, the Value Display box shows the value
of the last data point collected. Off-line, in Single Cursor mode, the Value Display box displays
the Y-axis value of the data point intersected by the cursor. In 2 Cursor mode, the Value
Display box displays the difference between the Y-axis values intersected by the two cursors.
Figure 3-2: The common controls for channels displayed in the DataTrax2 Main window.
Cursors If someone handed you a paint brush, gestured in a general direction, and said: “Paint that!”;
you would probably want to clarify exactly what “that” was. In mathematical terms, the verb
“paint” is the function and the object “that” is the argument. In mathematical operations, it is
important to understand exactly the “that” on which you are operating.
This is also true for DataTrax2 software. Many commands are included in the program that
allow the user to zoom, measure and calculate. In order for these commands to work, a
mechanism is required for directing the software to focus on a range of data or specific data
points of interest. DataTrax2 uses cursors to identify the data points. The explanation of cursors
begins with basic modes of operation and how to apply them in the window where the cursors
are used.
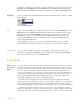
Cursor Modes Cursors are vertical blue lines that pass through all channels. The DataTrax2 software has two
cursors. Icons in the toolbar allow you to choose between using Single Cursor or 2 Cursor
modes (Figure 3-3 on page 21). Cursors can also be “garaged,” or placed all the way to the left
hand side of the data so they measure or report nothing. Cursors in the DataTrax2 software are
always in one of three modes — garaged, single, or 2 cursor.
Figure 3-3: Cursor controls on the DataTrax2 Main window toolbar.
To access Single Cursor mode, press the Single Cursor icon (Figure 3-3 on page 21) in the
toolbar. In this mode, the value of the data point on each channel that is intersected by the
cursor bar, is reported in the Value Display area on the right side of each channel bar. The time