
Instruction manual

. .
2 Acquisition 10
Chapter 2: Acquisition
The Basics
Time,
Temporal
Resolution,
Sample
Speed, and
Aliasing
Temporal resolution in digitally recorded data is determined by the sampling rate, also known as
sampling speed. To select a suitable sampling rate, you will need some background on the
theory and use of analog-to-digital converters (ADC).
The ADC in the WPI computer interface takes simple voltage measurements at regular
intervals. The voltage measurements (Y-axis values) and the times at which the voltages were
recorded (X-axis values) are sent by the WPI interface to the DataTrax2 software as a pair of
(X,Y) coordinates. The DataTrax2 software displays these coordinates as data points by plotting
them. The software then connects the data points with a line to create the smooth, graphical
appearance of an analog chart recording; but, only the data points themselves are hard
measurements. The lines that are drawn to connect the data points are “educated guesses”
made by the software and may be misleading. For example, if the sampling speed being used is
not fast enough for the data being recorded, the display will not accurately represent the real
data. This misleading behavior of data acquisition software, can be avoided by using a sampling
speed that is fast enough for the data being recorded.
When the sampling speed is set in DataTrax2 software, the hardware is being told what the
time interval between samples will be. For example, 100 samples per second equals one sample
every 10 milliseconds. To avoid creating displays that may be misleading, a simple question
about the sampling interval needs to be asked: Is there a chance that something important has
occurred between the sample points?
If the answer is “yes,” then the sampling speed must be increased in order to see and record
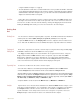
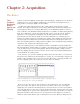
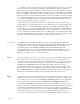
that event. In the example presented in Figure 2-1 on page 10, a sine wave with a frequency of
100Hz is sent to the ADC. In the screen on the left, the data points, recorded by an ADC set to
the same sampling speed as the frequency of the sine wave, are marked.
Figure 2-1: A 100Hz sine wave recorded at 100Hz. The samples coincide with the peaks of
waves; so, the data points can be connected by a straight line.
Because the sine wave has the same frequency as the sampling rate, each recorded data
point occurs at the same place in each cycle of the sine wave. In the screen on the right, a
straight line is the result when the data points are connected. The line is a false representation
of the real data, which is a sine wave. To fix the problem and render a better picture of the data,
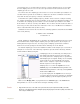
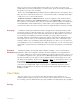
a faster sampling rate is required. If the sampling rate is increased to 110 samples a second, the
data points would be a millisecond closer to each other than at 100 samples a second, but a
100Hz sine wave would still have only one data point for each cycle. When the data points are