
Instruction manual

. .
1 Quick Start 8
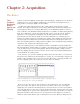
a single vertical line in Figure 1-1 on page 5).
4 The text attached to a mark can be seen at the bottom of the screen, just above the timeline. Text marks
can be dragged and dropped anywhere in the record. For example, a mark may denote that a drug was
administered at a certain time. Using the mouse, you can click on the text associated with a mark and
drag it to the channel to which it corresponds.
Scroll Bar Lastly, data can be navigated by using the scroll bar at the bottom of the Main window. Click
on the right scroll arrow to move to data on the right side of the screen. Click on the left scroll
arrow to move to data on the left side. Alternatively, clicking and dragging the waveform while
holding the Ctrl Key down allows you to move the waveform to the left and right.
Getting Data
Out
Printing Data The most obvious method of exporting data is to print it. The Print command in the DataTrax2
software prints the window (Main, Analysis, ScopeView, Journal) in the foreground.
To print the Main window, use the Display Time controls to adjust the amount of data on the
screen. Pull down the File menu and select Print, which prints only data visible in the window.
Copying and
Pasting Data
Data can be exported to the Journal or other word processing document using the Cut, Copy
and Paste commands located in the Edit menu of the program.
The Copy command always looks at the window in the foreground. For instance, using the
Copy command, while the Main window is in the foreground, copies the data in the Main
window to the clipboard (as a picture). Adjusting the screen time affects what data will be
included in the picture. Copying data is best done from the Analysis window; you have more
control over which channels and time domain will be displayed and copied.
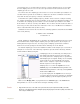
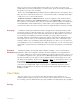
Exporting Data Select areas of data in the file can be saved for export.
• Select the area of data to be saved and exported using the 2 Cursor mode in the Main window.
• Click the Analysis button in the toolbar to view the selected data in the Analysis window.
• Open the File menu and select Export. A dialog box appears and provides for the naming and formatting
of the file to be exported from the Analysis window. Files to be exported can be saved as pictures (.bmp -
bitmap and .png - portable network graphics formats are currently supported), a text file (.txt - ASCII or
.atf - Axon Text), as a MatLab file (.mat), or a DADiSP file (.dat).
• Complete data files can be saved, from the Main window, as a MatLab file or DADiSP file.
Analysis Apart from the cursor measurements available in the DataTrax2 Main window, analysis occurs
in two places. Data manipulation, close examination, and a variety of calculations are handled in
the Analysis window, and wave to wave transforms are available in the Main window. For
specific information on the analyses that each of these categories can perform, refer to the
Analysis chapter in this manual. The basics are summarized in this chapter.