
User Guide


484
Running the Debugger
Running the Debugger
"
Professional and Enterprise Editions only.
The debugger runs through the actions in the Normal Installation mode only. It cannot
debug the Administrative or Advertisement installations.
1. In Wise for Windows Installer, open the .WSI, .MSI, or .MST to debug.
2. Click the Debug button. (In Visual Studio: In Solution Explorer, right-click the
installation project icon and select Set as Startup Project. Then select Debug menu
> Start.)
The installation is saved and compiled if you have made changes since the last
compile. You are prompted to select an .MSI if you defined more than one release.
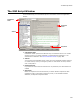
The debugger window opens.
3. Set breakpoints if desired. See Setting and Clearing Debugger Breakpoints.
4. To run the installation, do one of the following:
• Run through the actions
Select Debug menu > Go. This executes all actions up to the first breakpoint, if
any. As each action is processed, a white arrow appears to its left. When the
installation pauses at a dialog for end user input, the white arrow stops at the
next action to be processed.
• Run one action at a time
Select Debug menu > Step Over or Step Into to execute only the action with the
arrow to its left. After the action is processed, the arrow moves to the next line
and the debugger waits for another command.
Use Step Into if the installation contains one or more custom actions that call
VBScript, and you have the VBScript Debugger or Visual Studio with InterDev
installed. This opens the VBScript Debugger or Visual Studio and lets you debug
the VBScript. When you are finished, you can return to the installation in the
Debugger for Windows Installer.
Step Over runs VBScript actions but does not open the VBScript Debugger.
• Run to a selected action
Select the action, then select Debug menu > Run to Selection. This executes all
the actions up to the selected action. After the actions are processed, the arrow
moves to the selected action and the debugger waits for another command.
5. To stop the installation, select Debug menu > Stop Debugging or click Cancel in the
installation’s user interface.
Setting and Clearing Debugger Breakpoints
" Professional and Enterprise Editions only.
A breakpoint is a place in the installation where you temporarily halt the execution. You
set breakpoints in the Actions pane of the debugger. When you set a breakpoint and
then run the installation, it pauses at the breakpoint and waits for another command.
You can set multiple breakpoints.
To set a breakpoint:
Click the action at which you want to set a breakpoint, then press F9.
You can set breakpoints on sequences and control events only.