
User Guide


Statistics
131
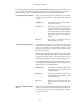
• Filter: a display filter for this graph (only the packets that pass this filter will be taken into account
for this graph)
• Style: the style of the graph (Line/Impulse/FBar/Dot)
• X Axis
• Tick interval: an interval in x direction lasts (10/1 minutes or 10/1/0.1/0.01/0.001 seconds)
• Pixels per tick: use 10/5/2/1 pixels per tick interval
• View as time of day: option to view x direction labels as time of day instead of seconds or minutes
since beginning of capture
• Y Axis
• Unit: the unit for the y direction (Packets/Tick, Bytes/Tick, Bits/Tick, Advanced...) [XXX - describe
the Advanced feature.]
• Scale: the scale for the y unit (Logarithmic,Auto,10,20,50,100,200,500,...)
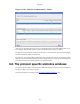
The save button will save the currently displayed portion of the graph as one of various file formats. The
save feature is only available when using GTK version 2.6 or higher (the latest Windows versions comply
with this requirement) and Wireshark version 0.99.7 or higher.
The copy button will copy values from selected graphs to the clipboard in CSV (Comma Separated Values)
format. The copy feature is only available in Wireshark version 0.99.8 or higher.
Tip!
Click in the graph to select the first package in the selected interval.
8.7. Service Response Time
The service response time is the time between a request and the corresponding response. This information
is available for many protocols.
Service response time statistics are currently available for the following protocols:
• DCE-RPC
• Fibre Channel
• H.225 RAS
• LDAP
• LTE MAC
• MGCP
• ONC-RPC
• SMB
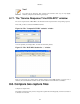
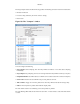
As an example, the DCE-RPC service response time is described in more detail.