
User's Manual
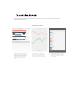
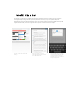

Temperature/Humidity Graphs
Each tag automatically logs temperature and each time it is moved, opened or closed, so you can always check what
happened while you were away.
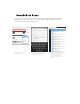
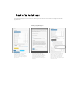
Temperature is logged periodically for
each tag at the interval specified at
Step4, "Out-of-range Notification." To
view logged data, click the graph
button and choose "Temperature
Graph".
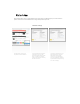
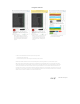
Initially, hourly (or if captured data
range is long enough, daily high/low)
graph will be displayed. Zoom in by
pinch gesture to view raw data points.
Click the buttons at upper right corner
to download all available raw data in
one CSV file or send the current graph
as an attachment.
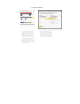
Temperature Graph