
User Manual
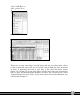
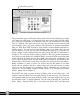
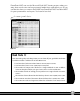

Figure 1-6
The presentation piece of Excel has always been a bit hard and frankly most of the
tools were not really there, or if they were they were hard to find. In Excel 2003,
you could have a maximum of 56 different colors in your workbook (see the Geek
Facts 1.1 sidebar). Also, there was just no easy way to make sure the colors looked
good together, unless you spent countless time and had your graphic artist friends
help you. Well, Excel 2007 includes a great number of improvements and new for-
matting options. You can have as many different colors as you’d like. Also, the cool
part for those of us who are not color coordinated but want to be, is that we can
assign a theme to the workbook (mine are always magically pink if I spend time to
change it). The nice part about assigning a theme is that you get the complemen-
tary colors to assign inside your workbook. But if you want to make sure certain data
points still show up clearly and you don’t really care about color coordination, you
can of course do that as well. Just be mindful that you might be questioned by the
fashion police. And for those color Divas out there you can create your own themes.
Really, a theme is a group of colors you choose; this way the reader of your data
knows all your expenses will be a certain color, and your total income a certain
color—you can also think of it as formatting. This is something you can define for
yourself or use pre-created common themes (Figure 1-7). To learn more about
themes, take a look at Chapter 7.
Excel 2007 also gives you time back by including a lot of new chart types, cool
graphics, and new Chart Tools that make looking at data very easy. You now have
more graphic ability and can apply shadows, bevels, and most anything else you can
do with other types of graphic elements. We can now all become our own Excel
Divas. What’s amazing about this is that Microsoft Word 2007 and Microsoft
Smar
t
Ar
t
fea
t
ure
Part I — Learn IT!
8
05 149164-ch01.qxp 7/16/08 2:17 PM Page 8