
Instruction Manual


III-16.5 Optimizing the controller
Process characteristics
Characteristics are determined automatically by the controller during self-tuning and converted into control parame
-
ters. In exceptional cases, however, manual determination of these process characteristics may be necessary. For this,
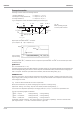
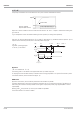
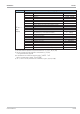
the response of process variable x after a step change of correcting variable y can be used (see Figure below).
Usually, it is not possible to plot the complete response curve (0 to 100 %), as the process must be kept within certain
limits.
The maximum rate of increase v
max
can be determined from the values T
g
and x
max
(complete step response) or Dt and
Dx (partial step response).
KTu
V
Xh
=××
max
%100
y = correcting variable
Y
h
= control range
Tu = delay time (s)
Tg = recovery time (s)
V
X
Tg
x
t
max
max
==
D
D
= max. rate of increase of process value
X
max
= maximum process value
X
h
= control range = x100 - x0
Characteristic values of the controllers
Generally, quick line-out to the without oscillation is required.
Dependent of process, different control actions should be used.
w
Processes with good controllability (K < 10%) can be controlled by means of PD controllers,
w
Processes with medium controllability (K = 10...22%) can be controlled with PID controllers and
w
Processes with bad controllability (K > 22%) can be controlled with PI controllers.
The control parameters can be determined from the calculated values of delay time T
u
, max. rate of inrease v
max
, con
-
trol range X
h
and characteristic value K according to the formulas. For more exact adjustment, see the hints given in
the table of parameter adjustment effects. Increase Xp if line-out oscillates.
Formulas
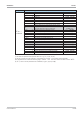
Parameter adjustment effects
Action Xp[%] Tv[s] Tn[s] Setting Control Line-out of distur
-
bances
Start-up behaviour
(D)PID 1,7 K 2 Tu 2 Tu
Xp
higher Increased damping Slower line-out Slower reduction pf energy
PD 0,5 K Tu Î = 0000 lower Reduced damping Faster line-out Faster reduction of energy
PI 2,6 K 0 6 Tu
Tv
higher Reduced damping Faster response Earlier reduction of energy
PK0Î = 0000 lower Increased damping Slower response Later reduction of energy
3-point stepping controller PID
Tn
higher Increased damping Slower line-out Slower reduction of energy
1,7 K Tu 2 Tu lower Reduced damping Faster line-out Faster reduction of energy
Controller 9499-040-82711
III-240 Optimizing the controller
Tu
Tg
t
{X
{t
x
y
100%
0%
Y
h
t
X
max
Fig.: 60 step response