
User's Manual Part 8
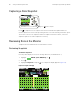
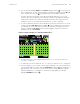
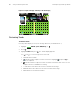


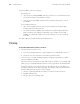
Table Of Contents
Directions for Use Storing and Reviewing Patient Data 99
Figure 93. Trends Display, 1-Minute Interval
4. Highlight and view any available reading in tabular or graphical format.
Changing the Trends Display Interval
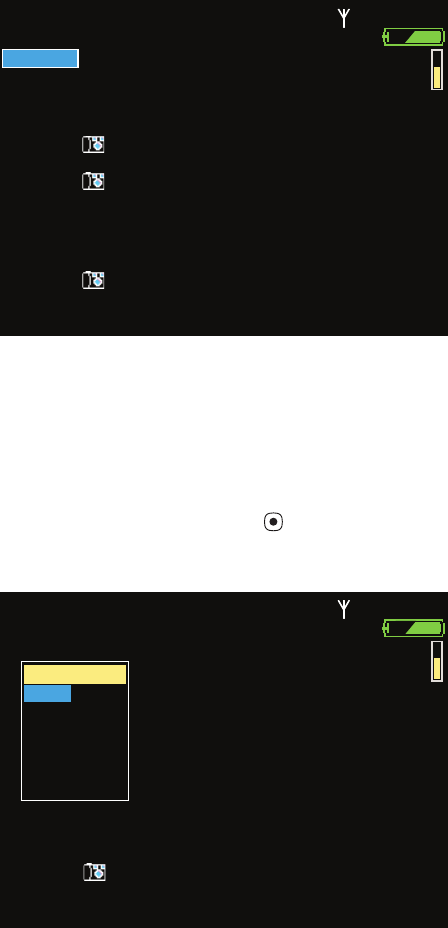
To Change the Trend Display Interval
1. Highlight Time and press .
Figure 94. View Interval Menu, 1-Minute Interval Selected
HR/min
HR/min
NIBP mmHg
NIBP mmHg
Resp/min
Resp/min
SpO2
SpO2
%
%
STEWART, ANN
STEWART, ANN
7762940
7762940
04:45:10P
04:45:10P
Adult
Adult
Rm 263
Rm 263
4:42P
4:42P
4:40P
4:40P
4:39P
4:39P
4:41P
4:41P
4:40P
4:40P
4:39P
4:39P
4:38P
4:38P
Time
Time
Tabular
Tabular
59
59
14
14
98
98
60
60
59
59
60
60
58
58
59
59
60
60
59
59
121/73(89)
121/73(89)
120/72(88)
120/72(88)
118/71(87)
118/71(87)
119/72(88)
119/72(88)
120/72(88)
120/72(88)
118/71(87)
118/71(87)
120/71(88)
120/71(88)
14
14
14
14
13
13
13
13
14
14
14
14
14
14
99
99
98
98
98
98
98
98
99
99
98
98
98
98
120/72(88)
120/72(88)
4:37P
4:37P
60
60
119/71(87)
119/71(87)
14
14
99
99
4:36P
4:36P
60
60
117/70(86)
117/70(86)
13
13
98
98
4:35P
4:35P
60
60
120/72(88)
120/72(88)
14
14
98
98
4:35P
4:35P
60
60
120/72(88)
120/72(88)
13
13
99
99
4:34P
4:34P
59
59
119/72(88)
119/72(88)
13
13
98
98
HR/min
HR/min
NIBP mmHg
NIBP mmHg
Resp/min
Resp/min
SpO2
SpO2
%
%
STEWART, ANN
STEWART, ANN
7762940
7762940
04:45:12P
04:45:12P
Adult
Adult
Rm 263
Rm 263
Time
Time
Tabular
Tabular
59
59
14
14
98
98
120/72(88)
120/72(88)
4:42P
4:42P
4:40P
4:40P
4:39P
4:39P
4:41P
4:41P
4:40P
4:40P
4:39P
4:39P
4:38P
4:38P
60
60
59
59
60
60
58
58
59
59
60
60
59
59
121/73(89)
121/73(89)
120/72(88)
120/72(88)
118/71(87)
118/71(87)
119/72(88)
119/72(88)
120/72(88)
120/72(88)
118/71(87)
118/71(87)
120/71(88)
120/71(88)
14
14
14
14
13
13
13
13
14
14
14
14
14
14
99
99
98
98
98
98
98
98
99
99
98
98
98
98
4:37P
4:37P
60
60
119/71(87)
119/71(87)
14
14
99
99
4:36P
4:36P
60
60
117/70(86)
117/70(86)
13
13
98
98
4:35P
4:35P
60
60
120/72(88)
120/72(88)
14
14
98
98
4:35P
4:35P
60
60
120/72(88)
120/72(88)
13
13
99
99
4:34P
4:34P
59
59
119/72(88)
119/72(88)
13
13
98
98
View Interval
View Interval
1 min
1 min
5 min
5 min
10 min
10 min
15 min
15 min
30 min
30 min
60 min
60 min