
User's Manual Part 8
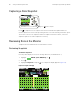
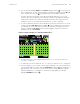
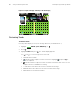


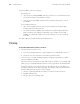
Table Of Contents
Directions for Use Storing and Reviewing Patient Data 97
4. The monitor first displays Select. With Select highlighted, press to view the list of
up to 20 snapshots. To view another snapshot, highlight the snapshot menu (#5 of 5
in the example above), press , and highlight any of the available snapshots.
The blue markers at the bottom of the waveform display represent one-second
intervals. The numeric data above the waveform represents the patient’s vital signs
measured at a specific time relative to that indicated in the lower right corner. For
example: In Figure 90, the data was measured at “1 Sec after” 14:34:58.
5. To view the waveform and the numeric data for a specific time within the 21 seconds
of data, highlight 1Secafter and then use or scroll the display to the desired time.
For example, to see the vital signs taken five seconds after the trigger point of the
snapshot, highlight 1 Sec after and press and hold as needed to increment the
display (Figure 91) to 5 Sec after.
Figure 91. Snapshots Display: 5 Seconds After the Button Press
6. To change the source of the displayed waveform, see “To Change the Waveform
Selection” on page 59.
7. To change the size of the waveform, see “To Change the Waveform Size” on page 60.
8. From this display, you can switch to another type of display or you can exit and return
to the primary display. To do this, highlight Snapshots and press . The Trends menu
appears (Figure 92), from which you can exit or switch to another display—Tabular,
Tabular and Waveform, or Graphical. To switch to the split display, for example,
highlight Ta b / Wa v e and press .
STEWART, ANN
STEWART, ANN
7762940
7762940
15:14:28
15:14:28
Adult
Adult
Rm 263
Rm 263
HR/min
HR/min
NIBP mmHg
NIBP mmHg
Resp/min
Resp/min
SpO2
SpO2
II 1mV/cm
II 1mV/cm
Snapshots
Snapshots
2/21/05
2/21/05
5 Sec after
5 Sec after
14:34:58
14:34:58
80
80
12
12
97
97
80
80
n/a
n/a
12
12
97
97
%
%
#5 of 5
#5 of 5