
User Documentation


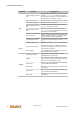


Table Of Contents
- Table of contents
- 1 Introduction
- 2 Safety instructions
- 3 System overview
- 4 Operating behavior
- 5 Software installation
- 6 Configuration
- 7 Program development
- 8 Licensing
- 9 Device Administration (DevAdmin)
- 10 Software units
- 11 OPC UA Server
- 12 Node-RED
- 13 LongtermDiagnosticMonitor
- 14 Data recorder
- 15 Diagnostics
- 16 Maintenance
- 17 Technical data
- 18 Directives and standards
- 19 Appendix: Tutorial - creating an IEC project
- 20 Appendix: Addressing in the Ethernet (basics)
- 21 Appendix: Tutorial FoE
- 22 Appendix: Tutorial - call C function from IEC
- Index

LongtermDiagnosticMonitor
System manual
2696790000/02/04.2020
74
Category Diagram Description
disk
Average latency for /dev/
sda
Average waiting time (latency) for access to the
directory /dev/sda. The waiting time shows
how utilized the system ist. 1 second waiting time
corresponds to an utilization of 100 %.
Disk IOs per device Inputs and outputs on the data carrier per device
Disk latency per device Waiting time on the data carrier
Disk throughput for /dev/
sda
Throughput of the data carrier for the directoy /
dev/sda [in Byte per second]
Disk utilization for /dev/
sda
Utilization of the data carrier for the directory /
dev/sda. If an input/output takes 1 second, the
data carrier is 100 % utilized.
IOs for /dev/sda
Number of inputs/outputs (I/O requirements) per
second and their average size [in kB] (in the dia-
gramm corresponds 1 kB = 1000 Byte).
Throughput per device
Throughput of inputs/outputs for directory /dev/
sda
Utilization per device
Utilization of directory /dev/sda [in percent]
munin
Munin processing time
Processing time of the four different Munin-pro-
cesses (munin update, munin graph, munin html,
munin limits) [in seconds]
Munin update
Time needed by Munin-processes for collecting
the recorded data [in seconds]
network
Firewall Throughput
Throughput of the firewall [received and for-
warded packages per second]
Netstat
TCP activity of all network interfaces. Number of
active, passive, failed, re-booted and current per-
formed TCP connections per second.
ETH0 errors
Number of errors, package losses and collission
on the ETH0 network interface.
ETH0 traffic
Data traffic of the ETH0 network interface [in bits
per second]
ETH1 errors
Number of errors, package losses and collission
on the ETH1 network interface.
ETH1 traffic
Data traffic of the ETH1 network interface [in bits
per second]