
User Guide


Webroot Enterprise System Administrator Guide 57
Viewing the Server Status
The Dashboard Server Status panel lists the latest downloaded software and definition versions,
the current port settings, and the Webroot services status for the company server. The panel also
includes an overall server status.
• Critical (red)—One or more of the listed ports is closed or one or more Webroot
services is stopped.
• Good (green)—All of the listed ports are open and all Webroot services are running.
To view the Server Status:
1. From the Admin Console function tree, select Webroot Enterprise Dashboard > Server
Status.
• The Server Status panel displays.
2. Click Refresh to update the status.
3. If a service is not running, click the blue Start text to start it.
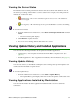
Viewing Update History and Installed Applications
You can view the following information about updates and installed applications:
• Update history—List of updates downloaded from the Webroot Update Server. (See
page 57.)
• Installed applications—List of applications installed by client workstation. (See page 57.)
Viewing Update History
You can view a history of when Webroot Enterprise Server and Spy Sweeper client updates were
downloaded from the Webroot Update Server.
To view the update history:
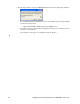
• From the Admin Console function tree, select Status > Update History.
• The Update History panel displays with a list of all of the updates downloaded to date.
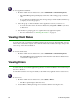
Viewing Applications Installed by Workstation
You can view information about the applications installed and the version for each client
workstation.