
User Guide

Webroot Enterprise System Administrator Guide 53
5: Monitoring Status
You can monitor the status of Webroot Enterprise in the following ways:
• Review the Webroot Enterprise Dashboard (see page 53)
• View update history and installed applications (see page 57)
• View client status (see page 58)
• View errors (see page 58)
• Generate reports (see page 59)
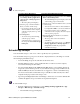
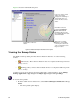
Reviewing the Webroot Enterprise Dashboard
The Webroot Enterprise Dashboard shows you an overview of your overall system health. The
main Dashboard panel lets you see at a glance whether you have any issues that require your
attention in the following categories:
• Sweep Status—Shows whether client workstations have completed a full sweep within the
last week. (See page 54.)
• Definition Status—Shows whether client workstations have the current definitions
installed. (See page 55.)
• Infection Status—Shows whether threats have been found on client workstations. (See
page 55.)
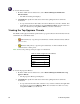
• Top Spyware Threats—Shows whether moderate or critical threats have been found on
client workstation in the last 48 hours. (See page 56.)
• Server Status—Shows the last downloaded software versions, port status, and Webroot
Enterprise services status. (See page 57.)
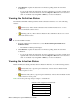
Each category in the Dashboard can have one of the following statuses:
• Good (green)—All items in the category are good.
• Warning (yellow)—At least one item in the category has a warning status.
• Critical (red)—At least one item in the category has a critical status.
– See the details about each category for more information about what the status icons
specifically mean for the category.