
User Guide


Debugger Usage
2018 Microchip Technology Inc. DS50002751C-page 29
3.10 STARTING AND STOPPING DEBUGGING
To debug an application in MPLAB X IDE, you must create a project that contains your
source code so that the code may be built, programmed into your device, and executed
as specified below:
• To run your code, select either Debug>Debug Main Project
or from the Run
toolbar.
• To halt your code, select either Debug>Pause
or from the Debug toolbar.
• To run your code again, select either Debug>Continue
or from the Debug
toolbar.
• To step through your code, select either Debug>Step Into or from the Debug
toolbar. Be careful not to step into a Sleep instruction or you will have to perform a
processor Reset to resume emulation.
• To step over a line of code, select Debug>Step Over
from the Debug toolbar.
• To end code execution, select either Debug>Finish Debugger Session
or
from the Debug toolbar.
• To perform a processor Reset on your code, select Debug>Reset
from the Debug
toolbar.
Additional Resets, such as POR/BOR, MCLR
, and System, may be available,
depending on the device. Refer to the product data sheet for more information.
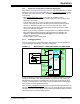
3.11 VIEWING PROCESSOR MEMORY AND FILES
MPLAB X IDE provides several windows for viewing debug and memory information.
These are selectable from the Window menu. See MPLAB X IDE online Help for more
information on using these windows.
• Window>Target Memory Views
- view data (Data Memory) and code (Execution
Memory) in device memory. Other memory can also be viewed as defined by the
device including Peripherals, Configuration Bits, CPU Registers, External EBI
Memory, External SQI Memory, User ID Memory, etc.
• Window>Debugging
- view debug information. Select from Variables, Watches,
Call Stack, Breakpoints, Stopwatch, and many others.
To view your source code, find the source code file you wish to view in the Projects win-
dow and double-click to open it in a Files window. Code in this window is color-coded
according to the processor and build tool that you have selected. To change the style
of color-coding, select Tools> Options
, Fonts & Colors, Syntax tab.
3.12 BREAKPOINTS AND STOPWATCH
Use breakpoints to halt code execution at specific lines in your code. Use the stopwatch
with breakpoints to time code execution.
• Breakpoint Resources
• Hardware or Software Breakpoint Selection
• Breakpoint and Stopwatch Usage
3.12.1 Breakpoint Resources
In 16-bit devices, breakpoints, data captures, and runtime watches use the same
resources. Therefore, the available number of breakpoints is actually the available
number of combined breakpoints/triggers.
Note: Refer to the MPLAB X IDE Help for information on menu option icons.