
User Guide


Debugger Usage
2018 Microchip Technology Inc. DS50002751C-page 27
3.5 DEBUGGER LIMITATIONS
For a complete list of debugger limitations for your device, see the online Help file in
MPLAB X IDE (Help> Tool Contents>Hardware Tool Reference>Limitations).
3.6 COMMON DEBUG FEATURES
Refer to the Help file “Getting Started with MPLAB X IDE,” Running and Debugging
Code section, for details on debug features. This section includes:
1. Debug Running the project (build, program and run) from Debug>Debug Main
Project.
2. Using breakpoints
3. Stepping through code
4. Using the Watches window
5. Viewing Memory, Variables and the Call Stack
6. Using the Call Graph
3.7 CONNECTING THE TARGET BOARD
1. Connect the Micro-B USB cable between the debugger and the computer, if not
already connected.
2. Connect the appropriate cable(s) between the debugger to the target.
3. Connect power to the target if needed.
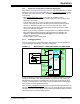
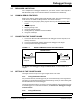
FIGURE 3-1: INSERT COMMUNICATIONS AND USB CABLES
See Section 2.2 “Debugger to Target Communication” for more details and a
diagram.
3.8 SETTING UP THE TARGET BOARD
The target must be set up for the type of target device to be used.
3.8.1 Using Production Devices
For production devices, the debugger may be connected directly to the target board.
The device on the target board must have built-in debug circuitry in order to debug with
the MPLAB PICkit 4 In-Circuit Debugger.
The target board must have a connector to accommodate the communications chosen
for the debugger. For connection information, see Section 2.2 “Debugger to Target
Communication”.
3.8.2 Using ICE Devices
MPLAB PICkit 4
To Target Board
USB Cable to
or Header
2
1
computer
Note: Headers are not supported at this time.