
User Guide


Operation
2018 Microchip Technology Inc. DS50002751C-page 21
2.5.1 Sequence of Operations Leading to Debugging
Given that the Requirements for Debugging are met, set the MPLAB PICkit 4 In-Circuit
Debugger as the current tool in MPLAB X IDE. Go to File>Project Properties
to open
the dialog, then under “Hardware Tool,” click PICkit 4. The following actions can now
be performed.
• When Debug>Debug Main Project
is selected, the application code is
programmed into the device’s memory via the ICSP protocol as described at the
beginning of this section.
• A small “debug executive” program is loaded into the high area of program
memory of the target device. Since the debug executive must reside in program
memory, the application program must not use this reserved space. Some
devices have special memory areas dedicated to the debug executive. Check
your device data sheet for details.
• Special “in-circuit debug” registers in the target device are enabled by MPLAB X
IDE. These allow the debug executive to be activated by the debugger. See
Section 2.7 “Resources Used by the Debugger” for more information on
device reserved resources.
• The target device is run in debug mode.
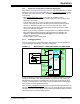
2.5.2 Debugging Details
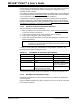
Figure 2-9 illustrates the typical default ICSP configuration for the MPLAB PICkit 4
In-Circuit Debugger system when it is ready for debugging.
FIGURE 2-9: MPLAB PICKIT™ 4 DEBUGGER READY FOR DEBUGGING
To find out whether an application program will run correctly, a breakpoint is typically
set early in the program code. When a breakpoint is set from the user interface of
MPLAB X IDE, the address of the breakpoint is stored in the special internal debug
registers of the target device. Commands on PGC and PGD communicate directly to
these registers to set the breakpoint address.
Next, the Debug>Debug Main Project
function is usually selected in MPLAB X IDE. The
debugger will then tell the debug executive to run. The target will start from the Reset
vector and execute until the Program Counter reaches the breakpoint address that was
stored previously in the internal debug registers.
+5V
+12V
Internal Circuits
Program
Memory
File
Registers
Internal
Debug
Registers
VPP/MCLR
PGC
PGD
1
5
4
Executive
Debug
Area Used by
Target
be
Running
must
for Debug
Executive
to Function
Area
VDD
Hardware
Stack Shared
by Debug Exec
Debug Exec
Reserved
for Debug
Executive