
User Guide
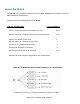
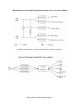
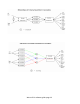
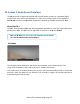
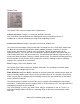
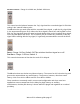
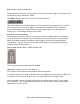
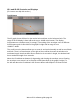
Table Of Contents
- Introduction
- Overview
- Managing Presets and IRs: The WaveSystem Toolbar
- About the IR-360
- IR-Series Controls and Displays

Waves IR-1 software guide page 19
IR-1 and IR-360 Controls and Displays
(IR-L users can skip this section.)
THE IR GRAPH
The IR graph shows dB level on the vertical axis and time on the horizontal axis. The
range of the IR display is from 0dB at the top to –90dB at the bottom. The display
incorporates an envelope curve (in orange). The scaling of the envelope curve is different:
its flat bypass point is two-thirds of the graph’s height and its range is from
+30dB to –60dB.
The scroll bar on the bottom allows you to zoom in and out horizontally as well as scroll back
and forth. There’s a Reset button on the right of the scroll bar that sets the window to its
maximum length. Note that while IRs are limited to six seconds in length, the window itself
has a maximum length of ten seconds.
Above the IR window are buttons for bypassing and clearing the envelope curve. Clearing
the envelope curve resets it to its flat point of 0dB (two-thirds of the graph’s height). To
the left and above the IR window is the Reverse button which flips the IR front-to-back.